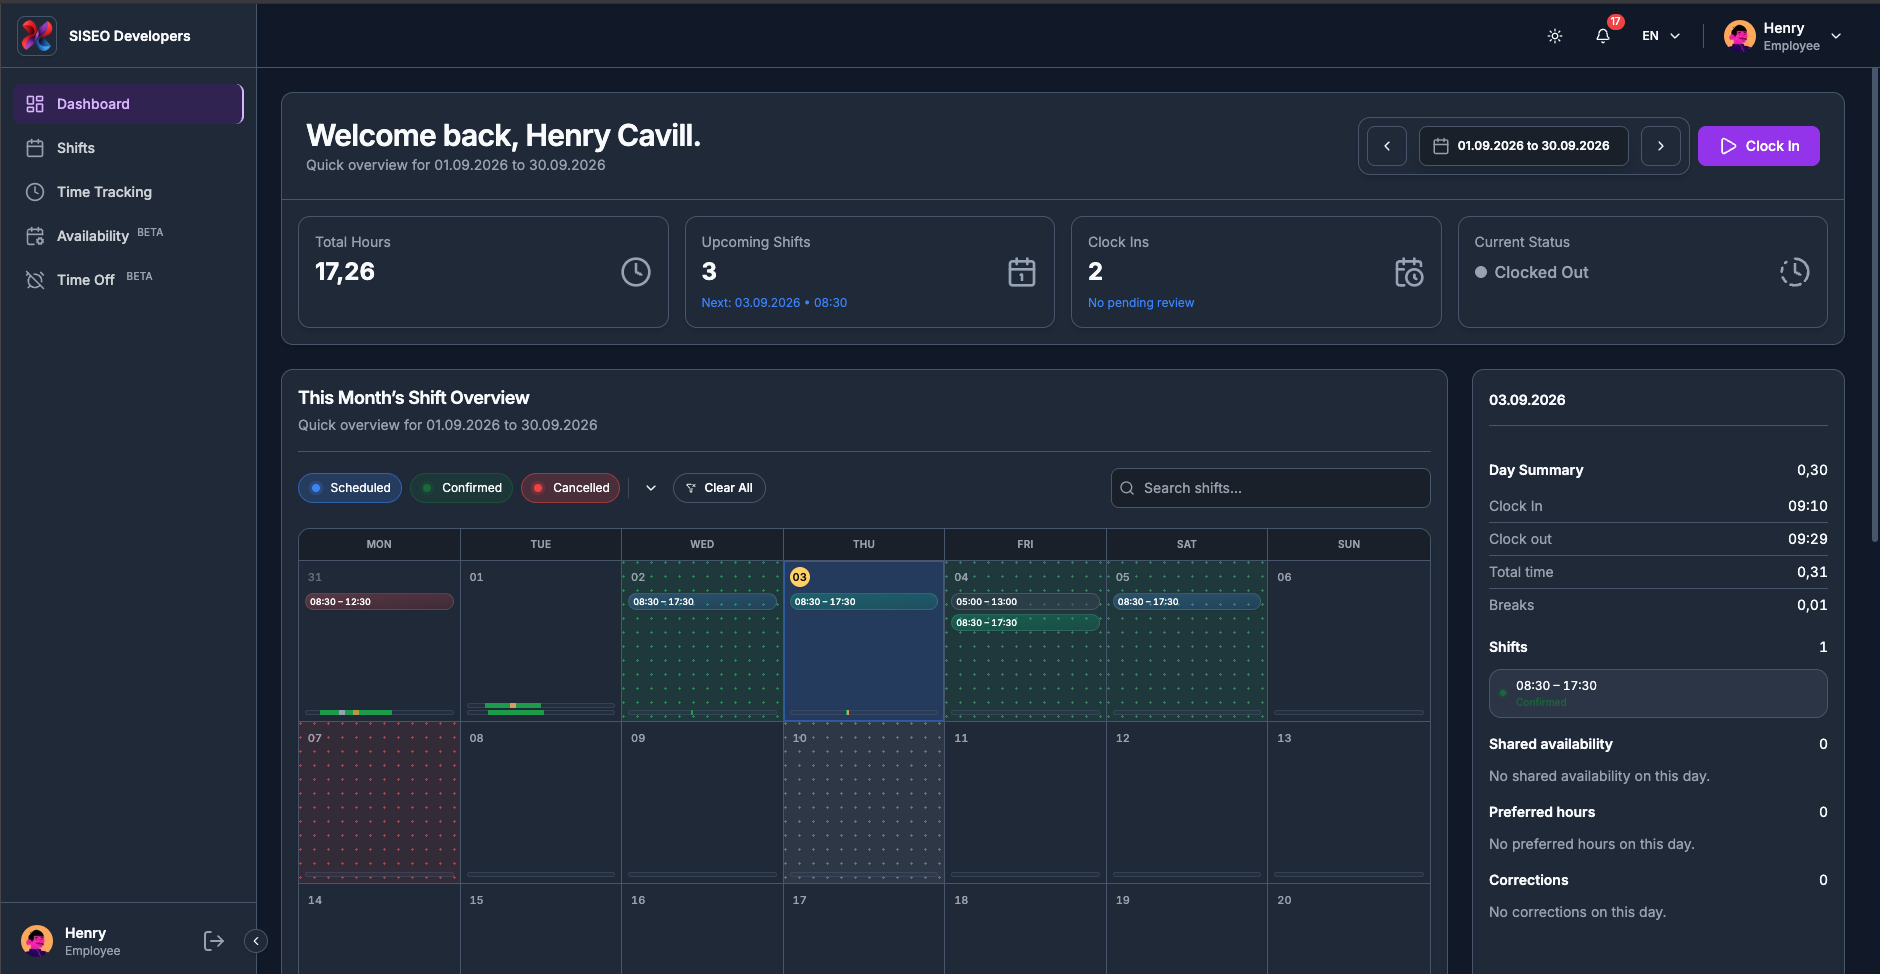
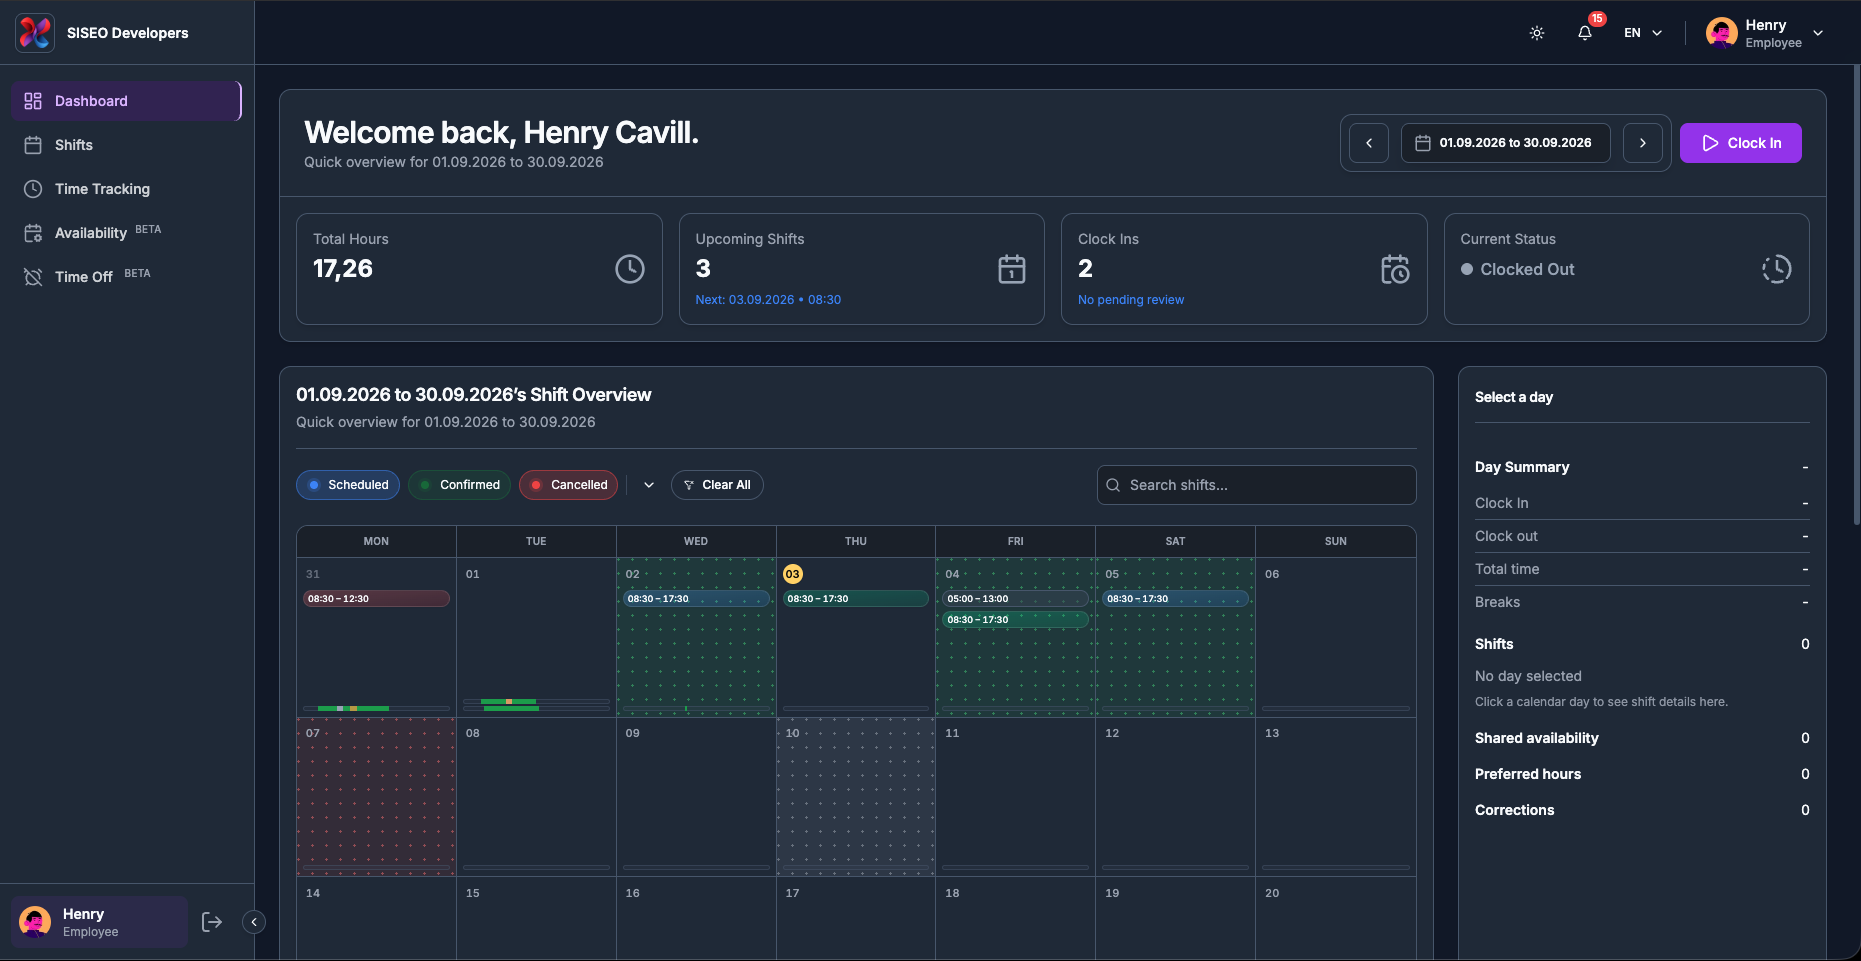
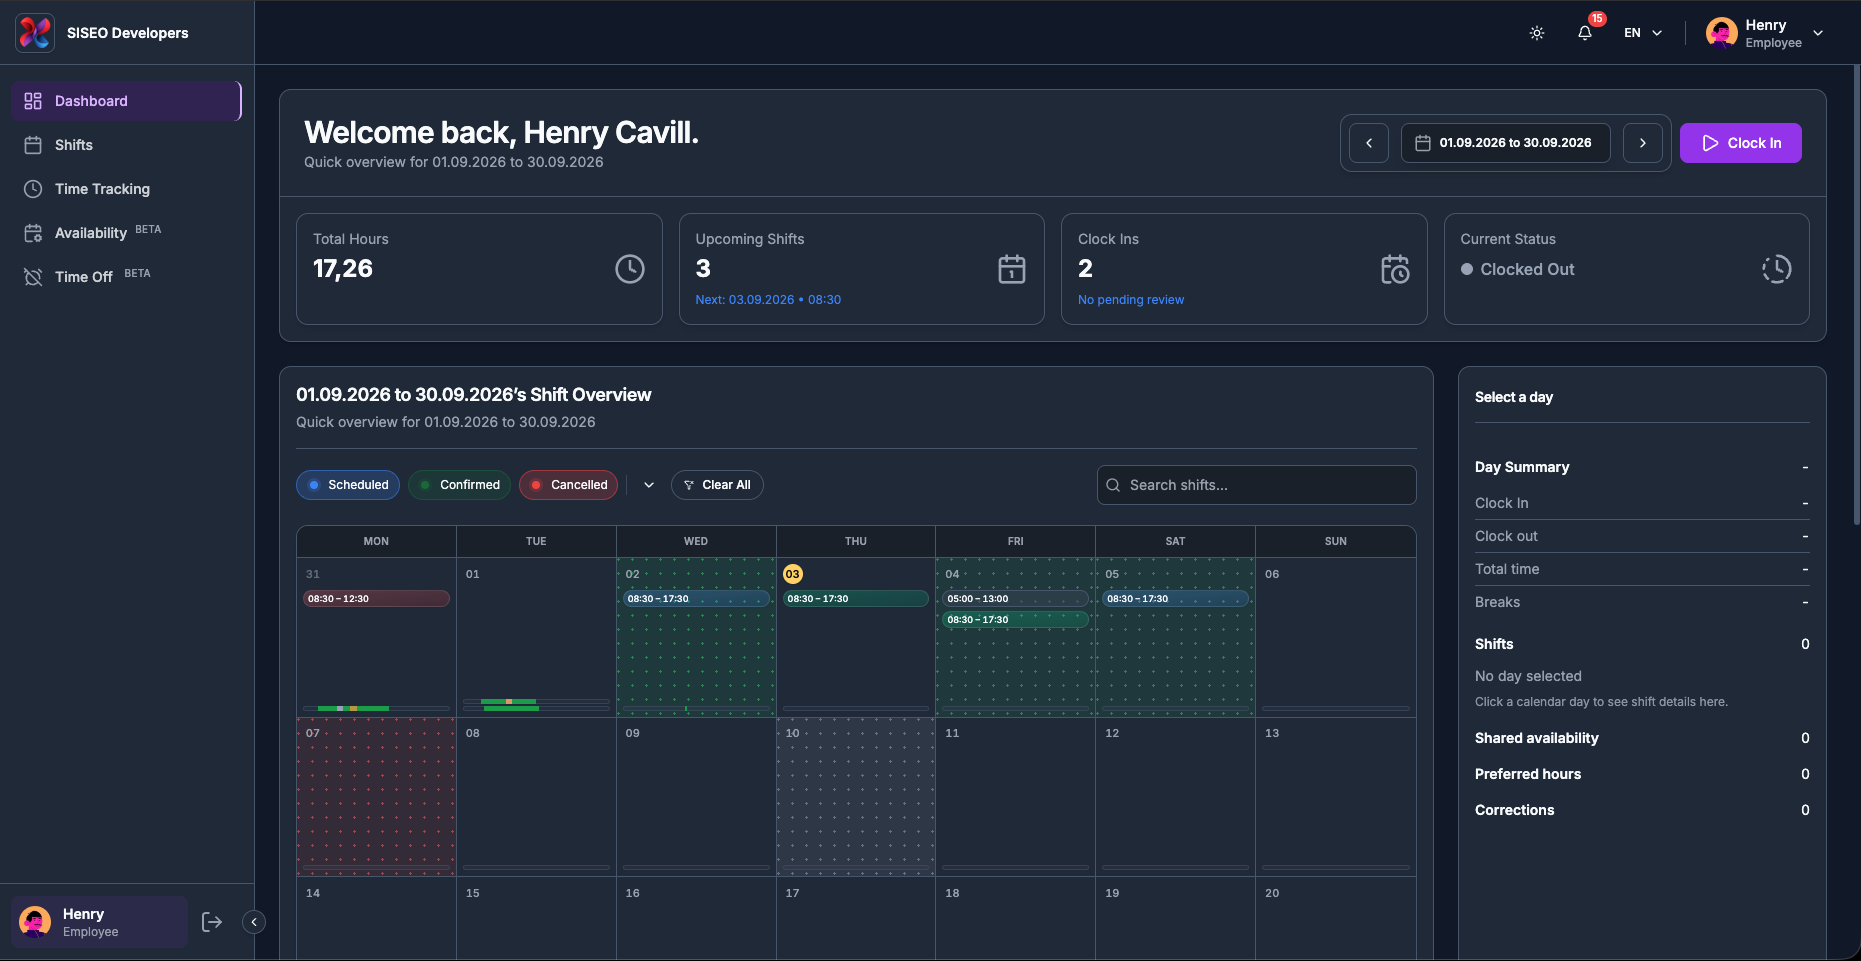
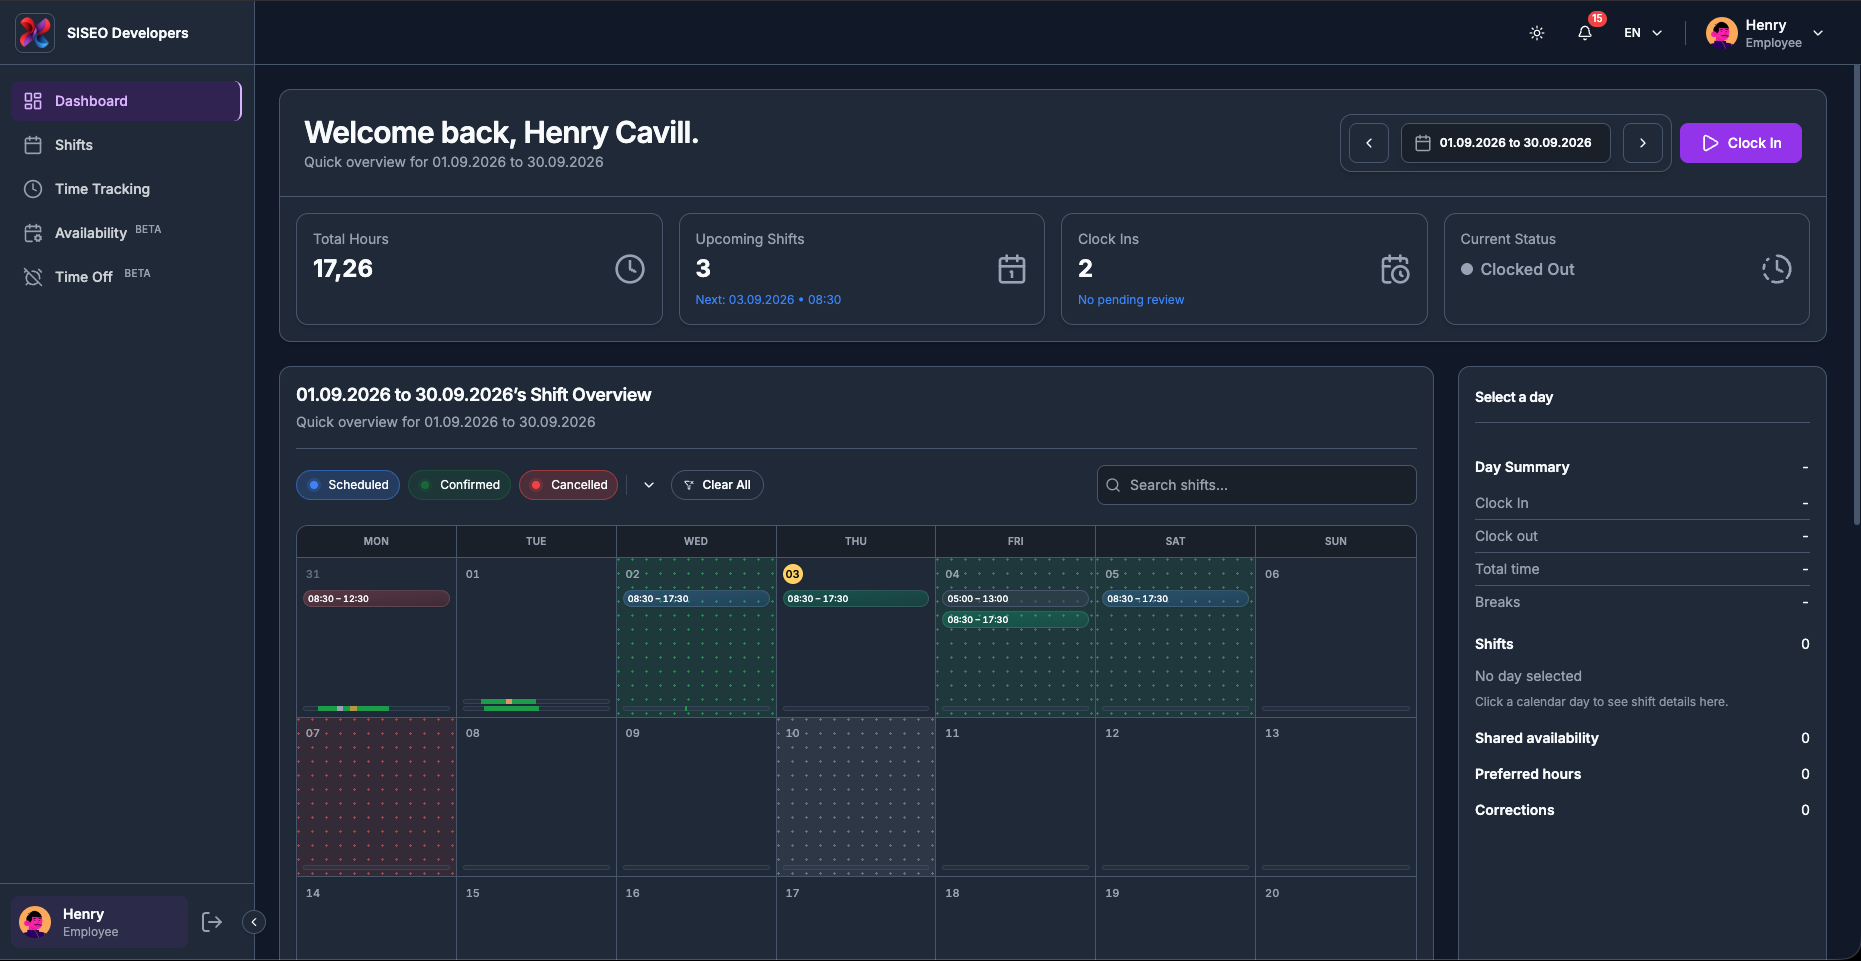
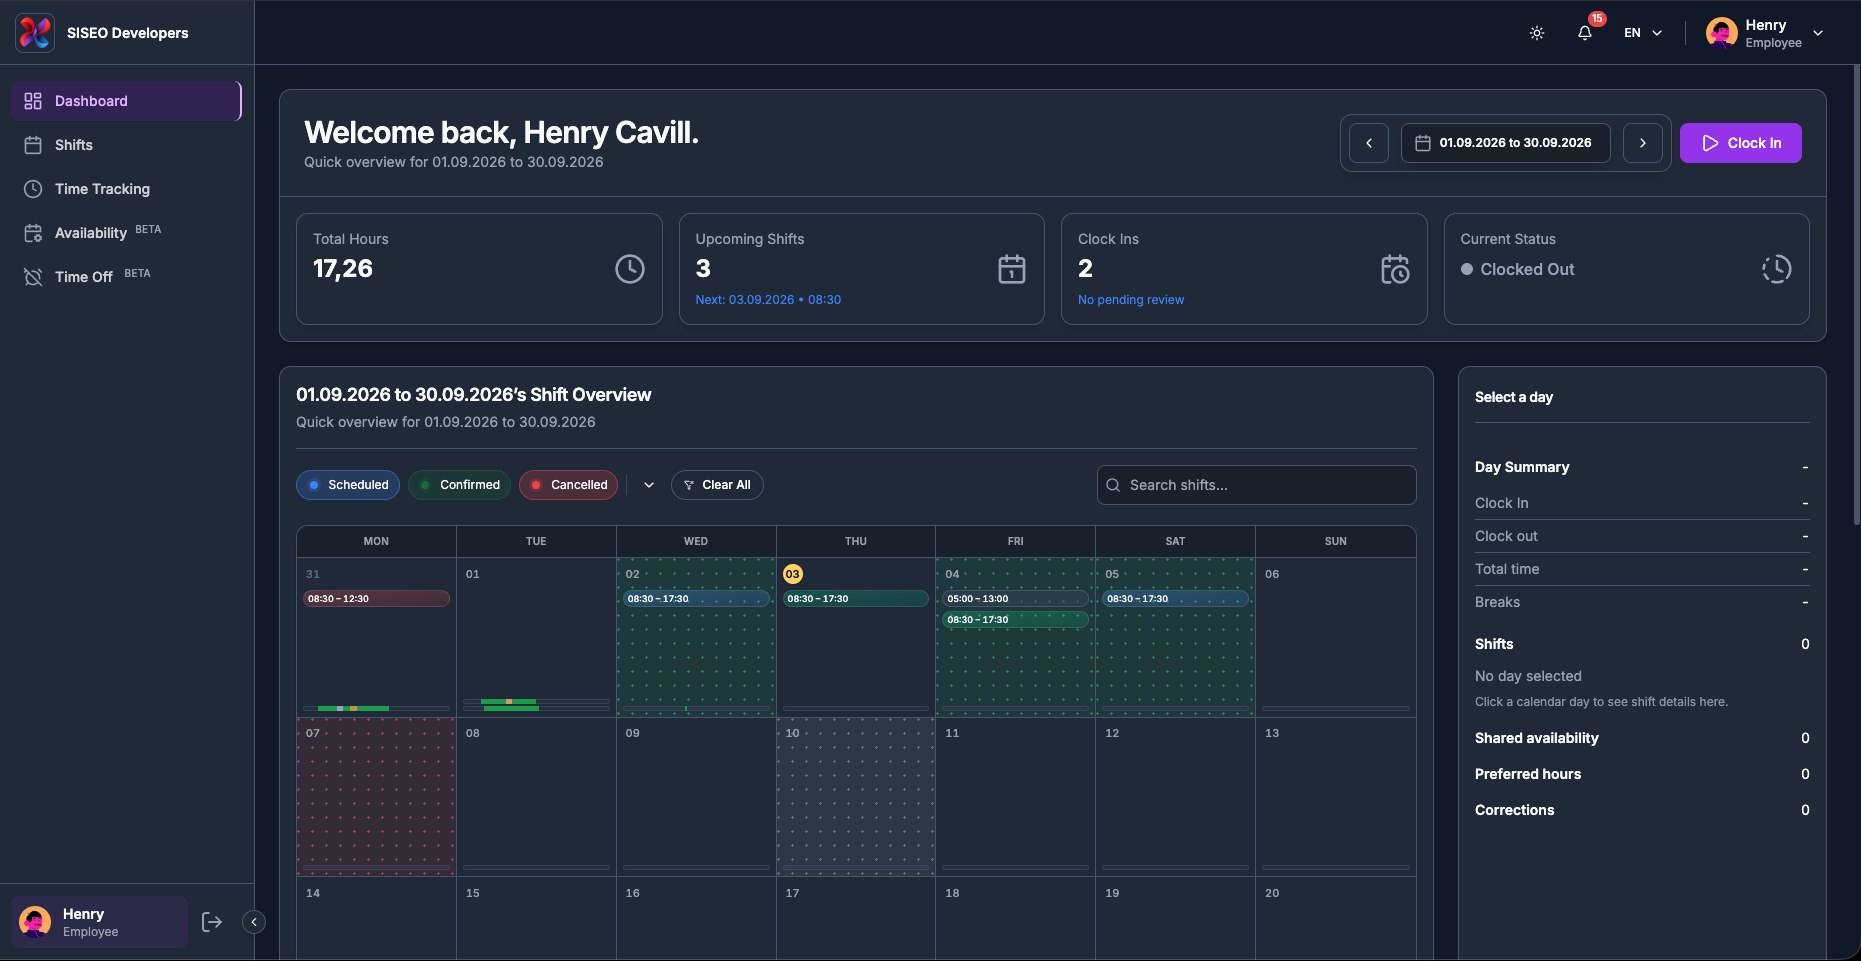
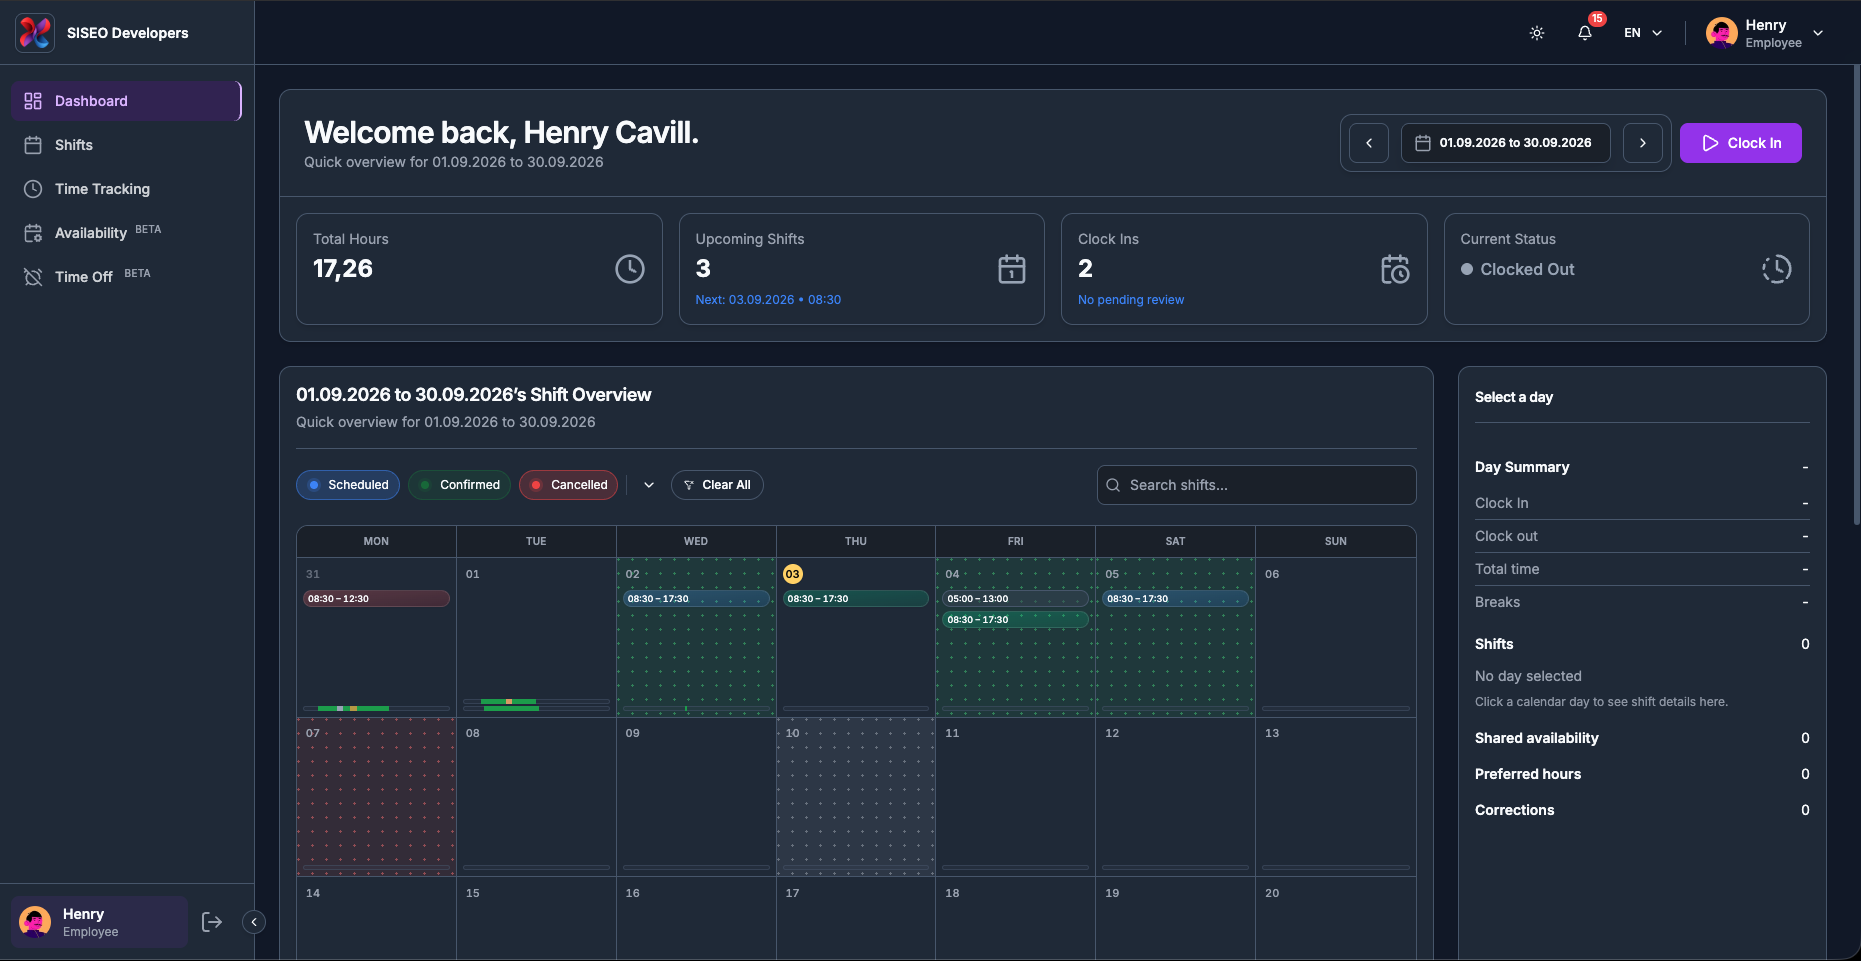
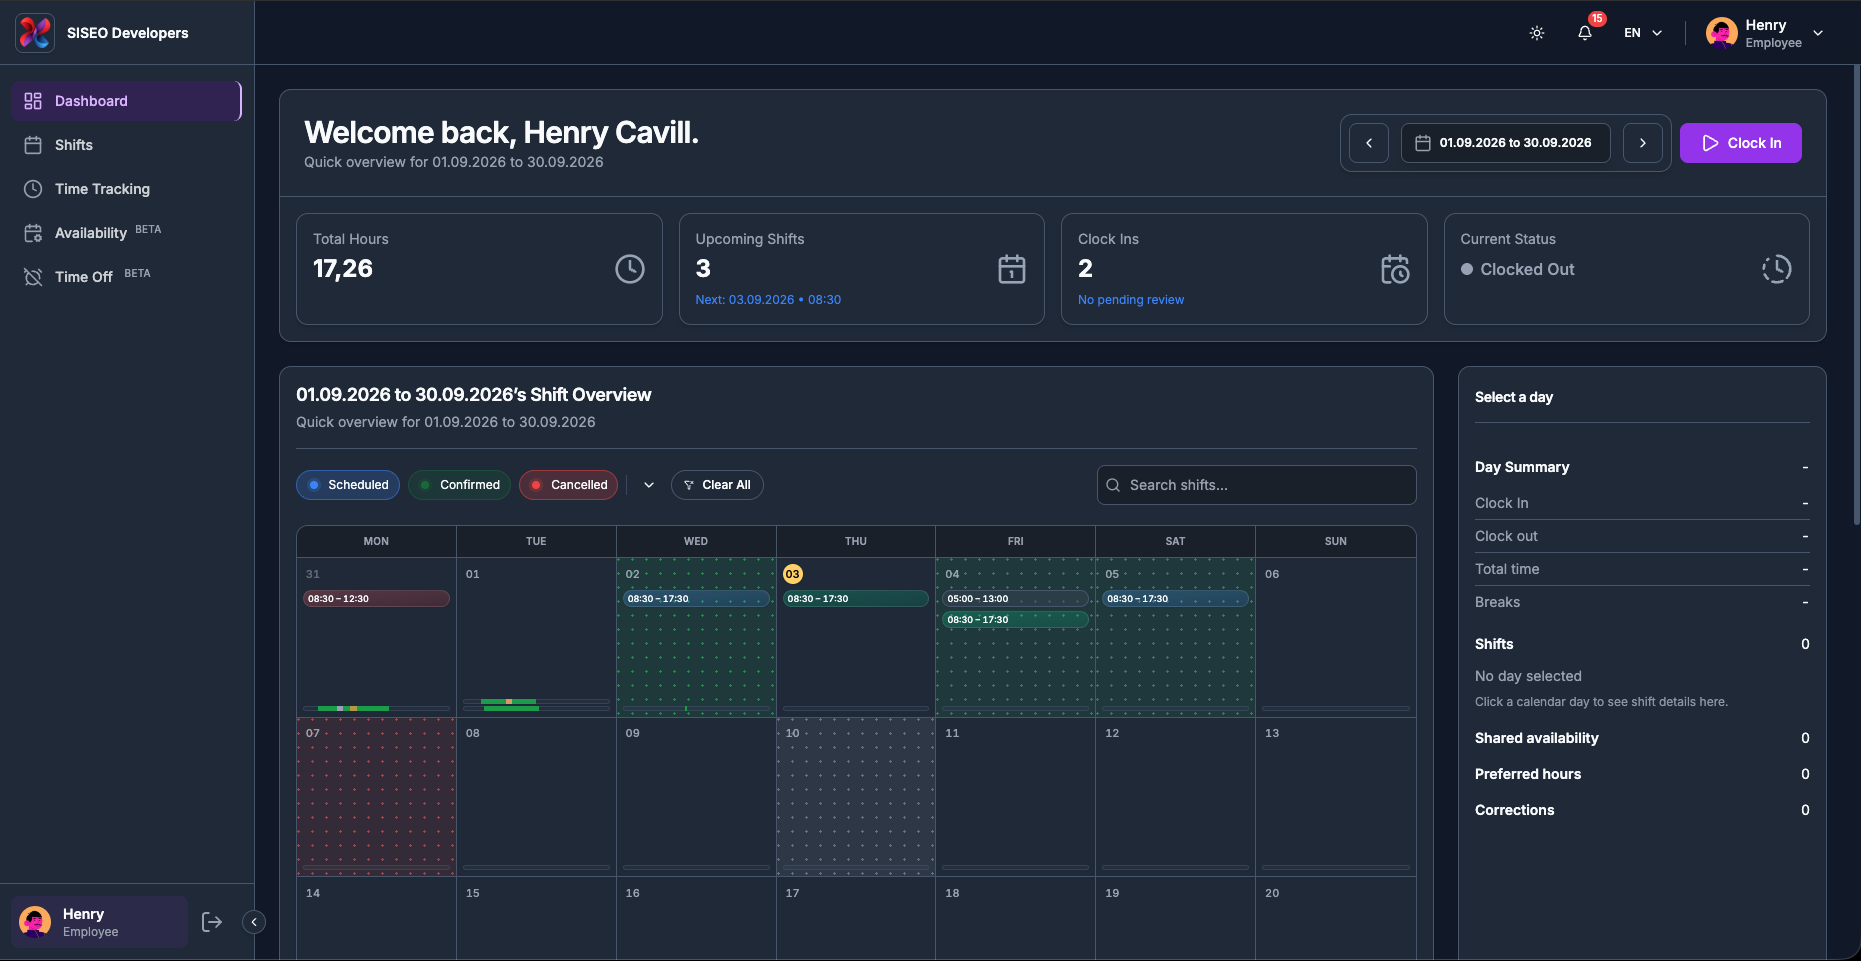
The Dashboard is the first page you see after signing in. It answers three questions at a glance, how many hours you have worked, what is coming up, and whether you are currently on the clock, and gives you a calendar of your shifts, availability and recorded time that you can browse day by day.
1.1Overview
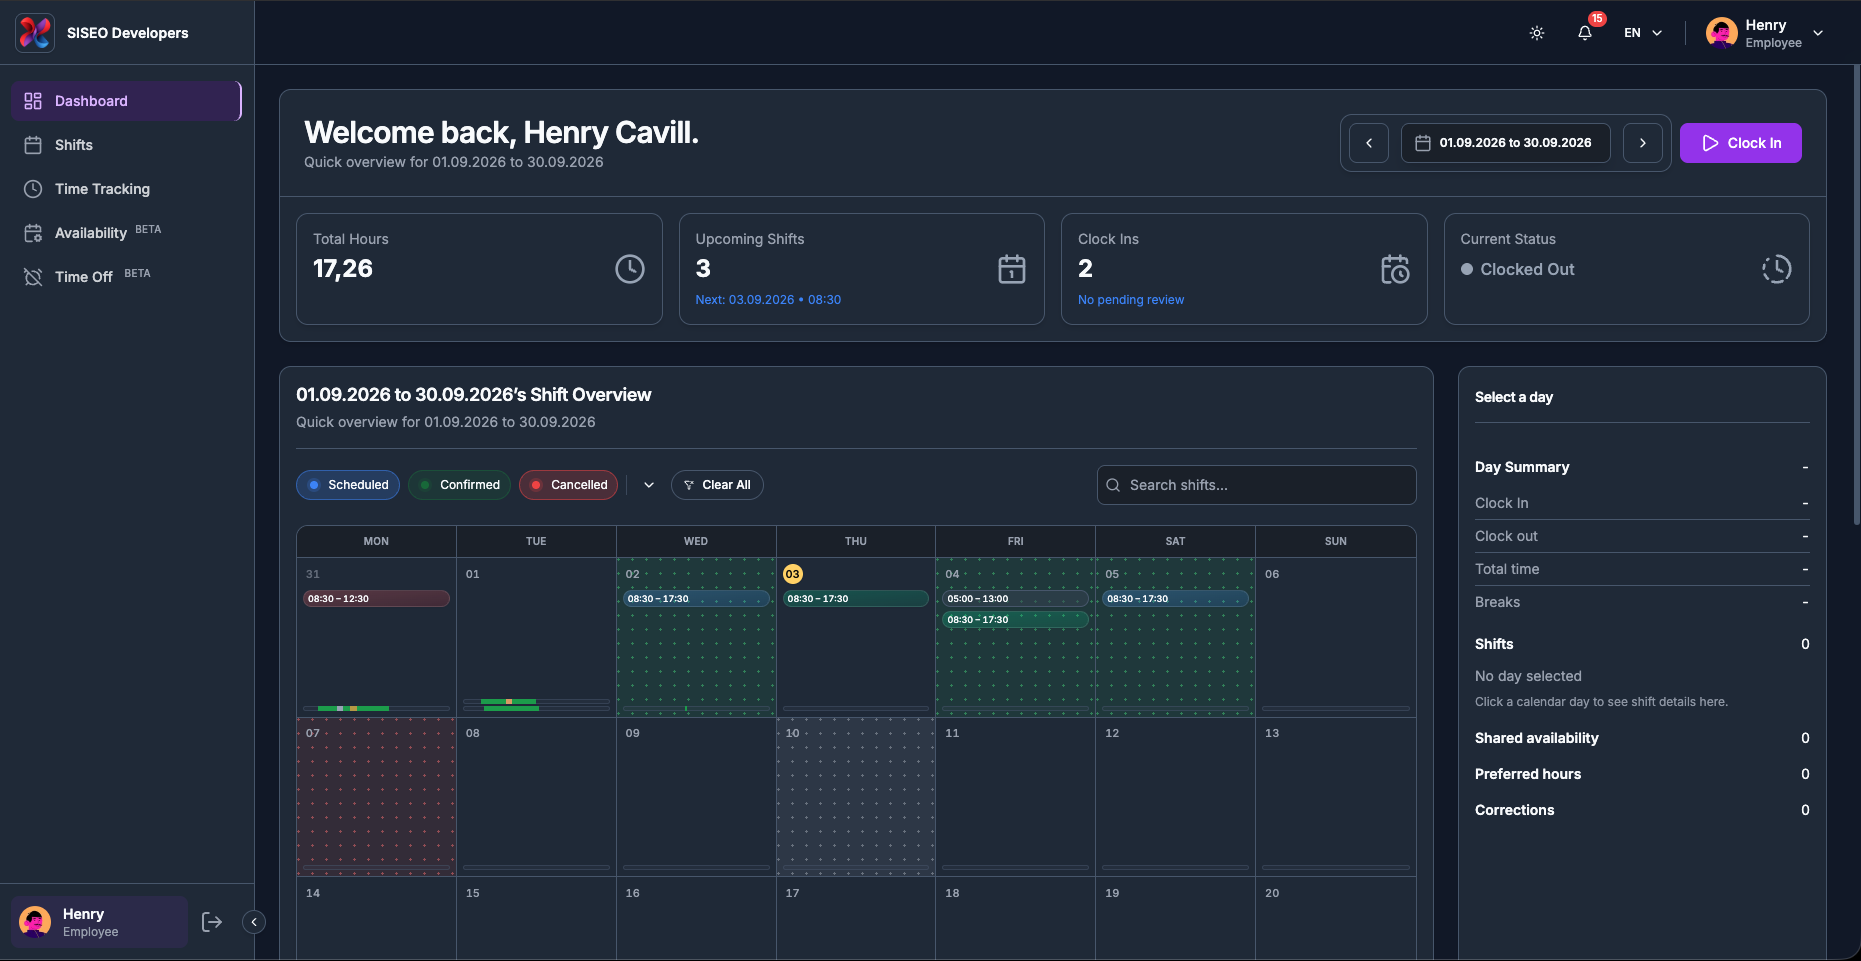
The Dashboard page is made of four stacked areas, from top to bottom:
1.2Header and stat cards
1.2.1What the header tells you
The header greets you by name, “Welcome back, <your name>.”, and directly underneath it prints the period everything on the page refers to, as “Quick overview for <date range>”. If you ever wonder why a number looks wrong, check this line first: every figure on the Dashboard is calculated for that range and nothing else.
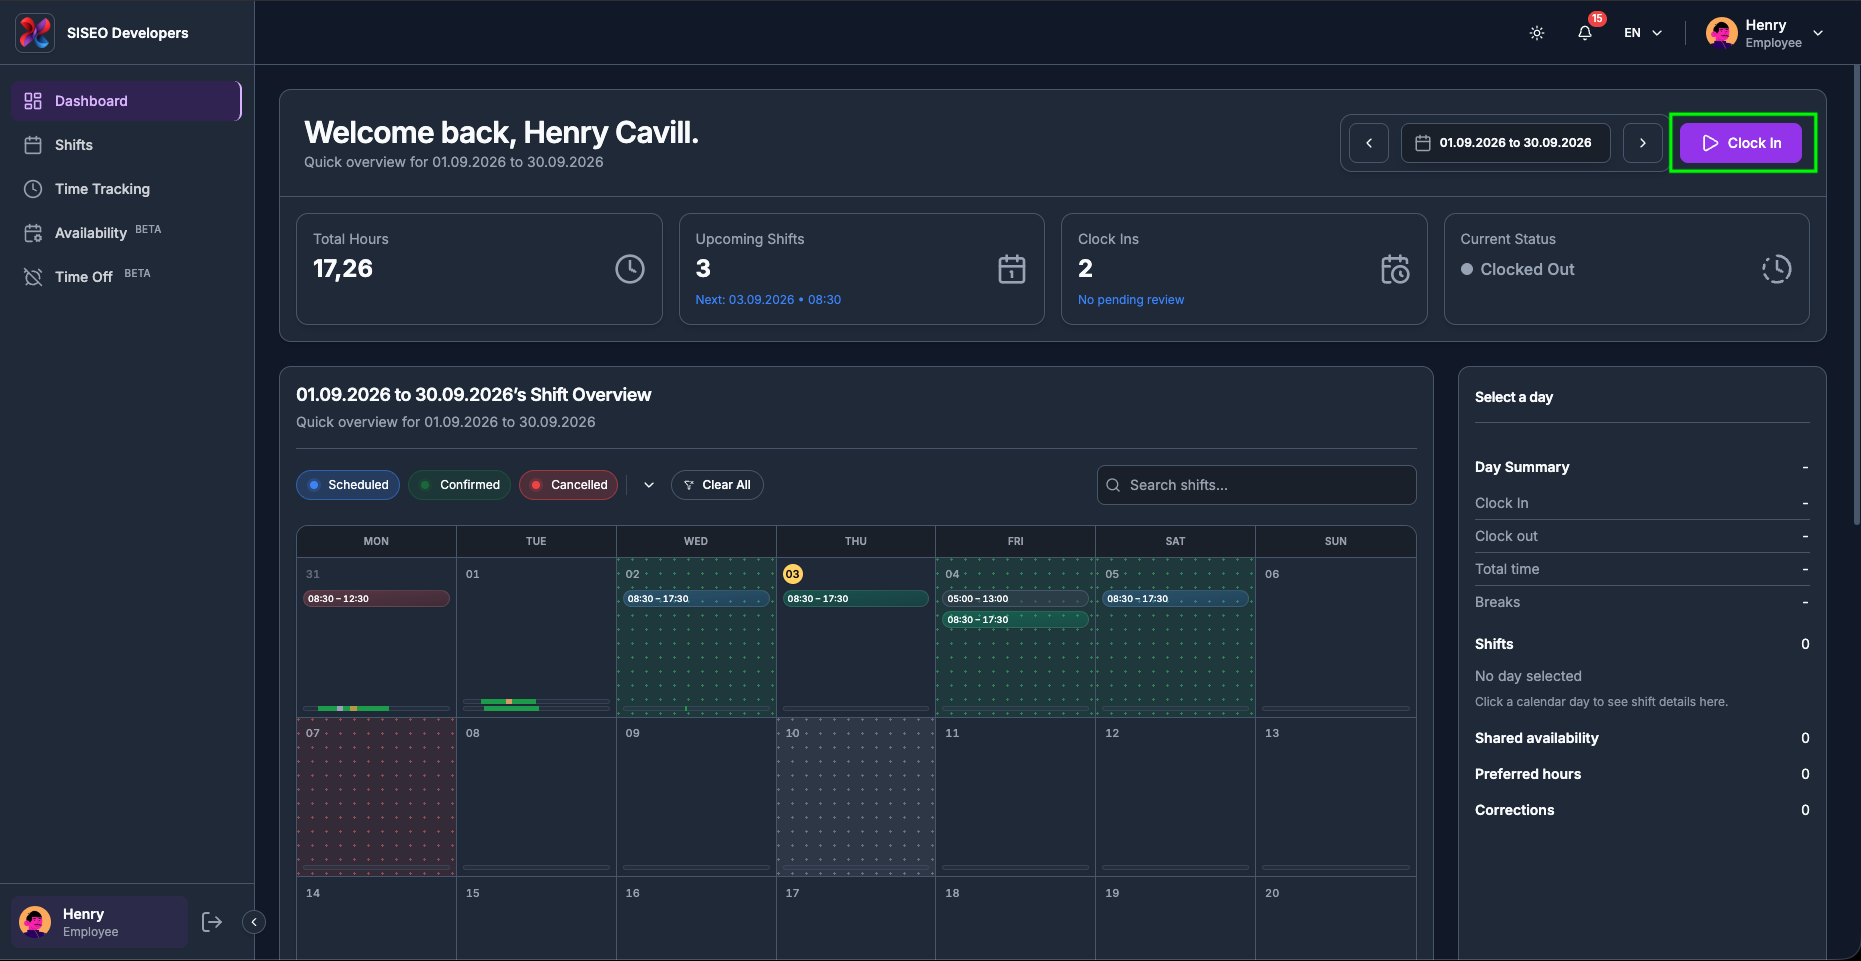
On the right-hand side of the header sit the date-range controls (2.4) and the clock button (2.5).
1.2.2How to read the stat cards
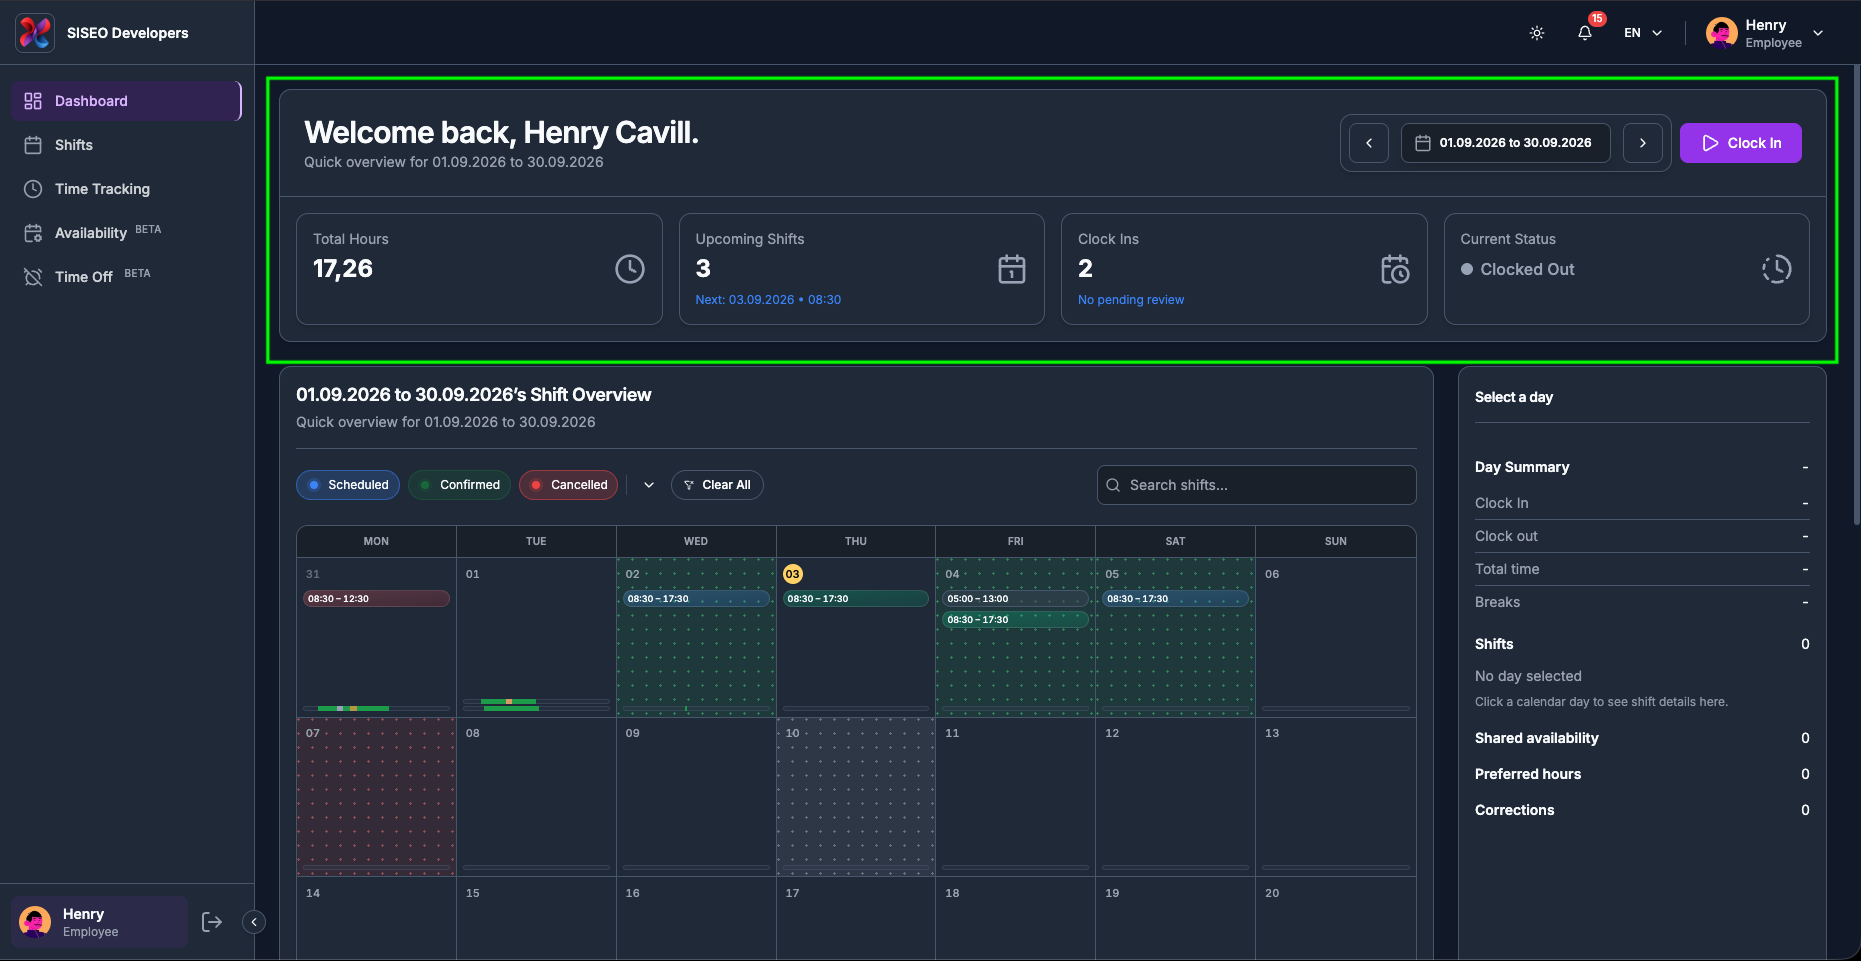
Four cards summarise the selected range. Each has a title, a large value, and in two cases a small line of extra detail underneath.
1.2.3Understanding Current Status
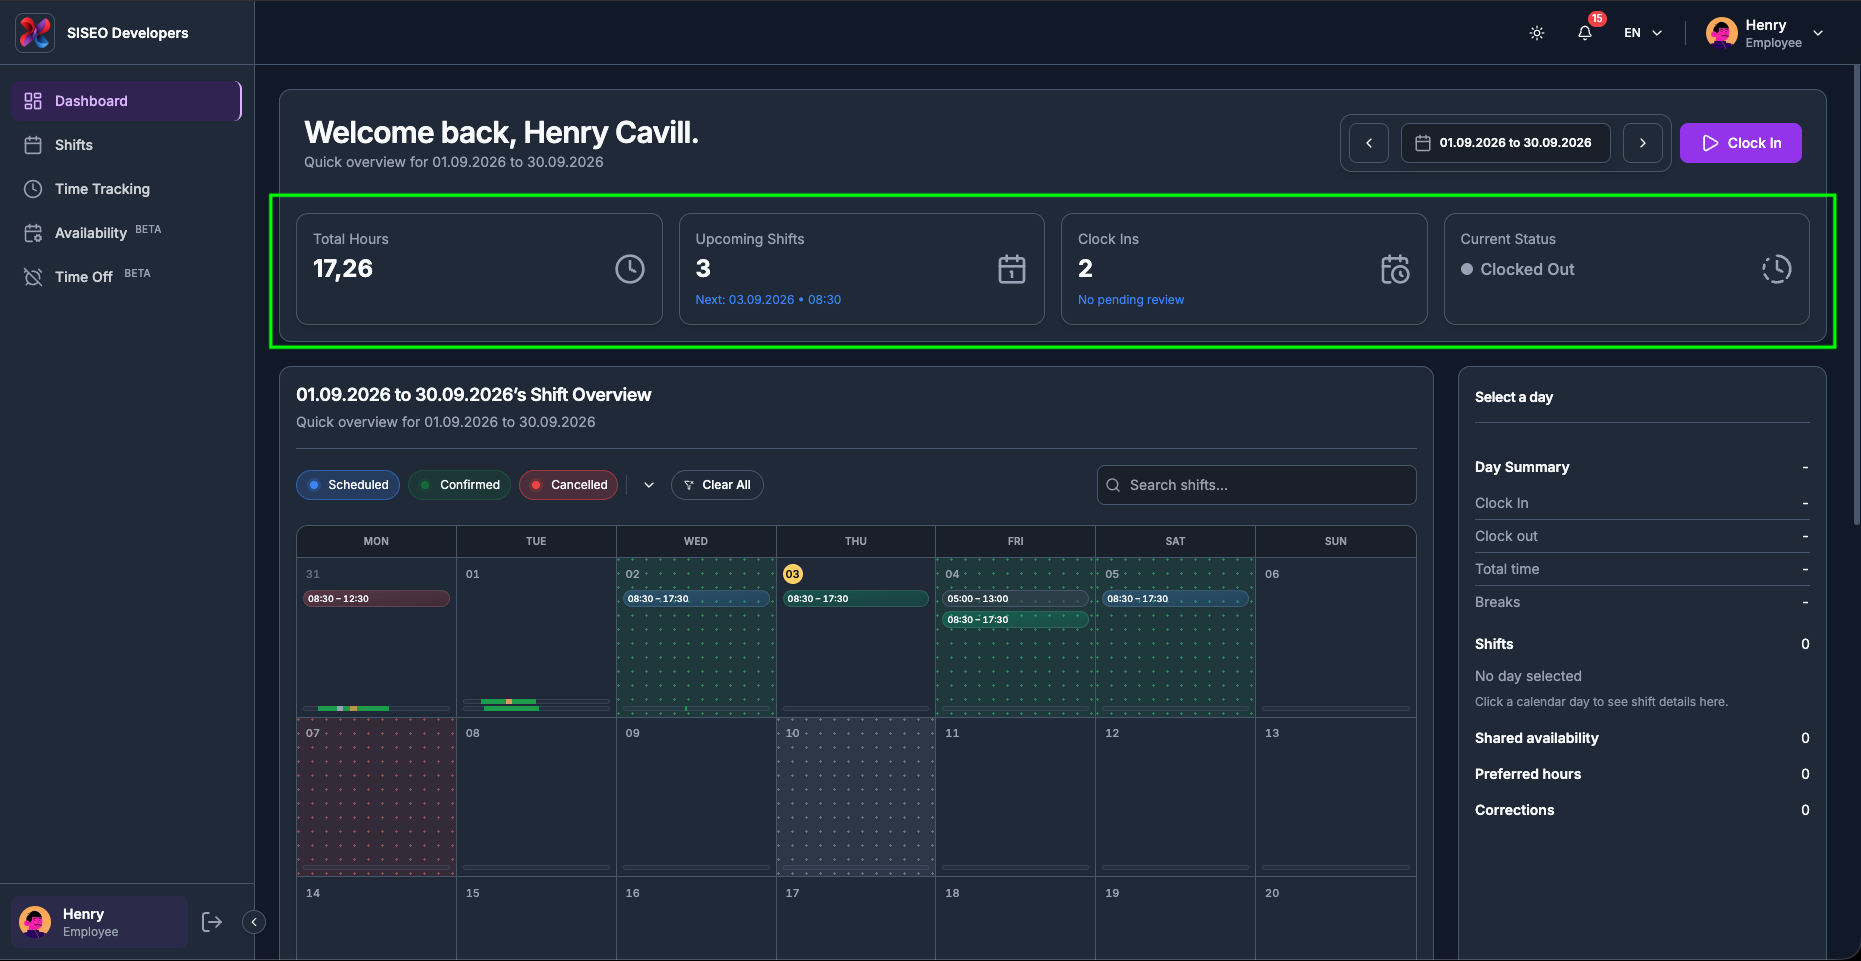
The Current Status card shows a coloured dot and a label:
| Status | Dot | Meaning |
|---|---|---|
| Clocked Out | Grey | You are not working. This is the normal state outside a session. |
| Clocked In | Green | A work session is running and your time is being counted. |
| On Break | Amber | Your session is still open but paused; break time is not counted as worked time. |
The same colour is used for the clock icon on that card, and for the dot in the session ribbon described in 2.2.2.
1.3Choosing the date range
Everything on the Dashboard, the stat cards, the calendar and the Day Summary, follows one date range. As an employee you start on this month each time you open the page.
1.3.1How to open the date picker
-
1
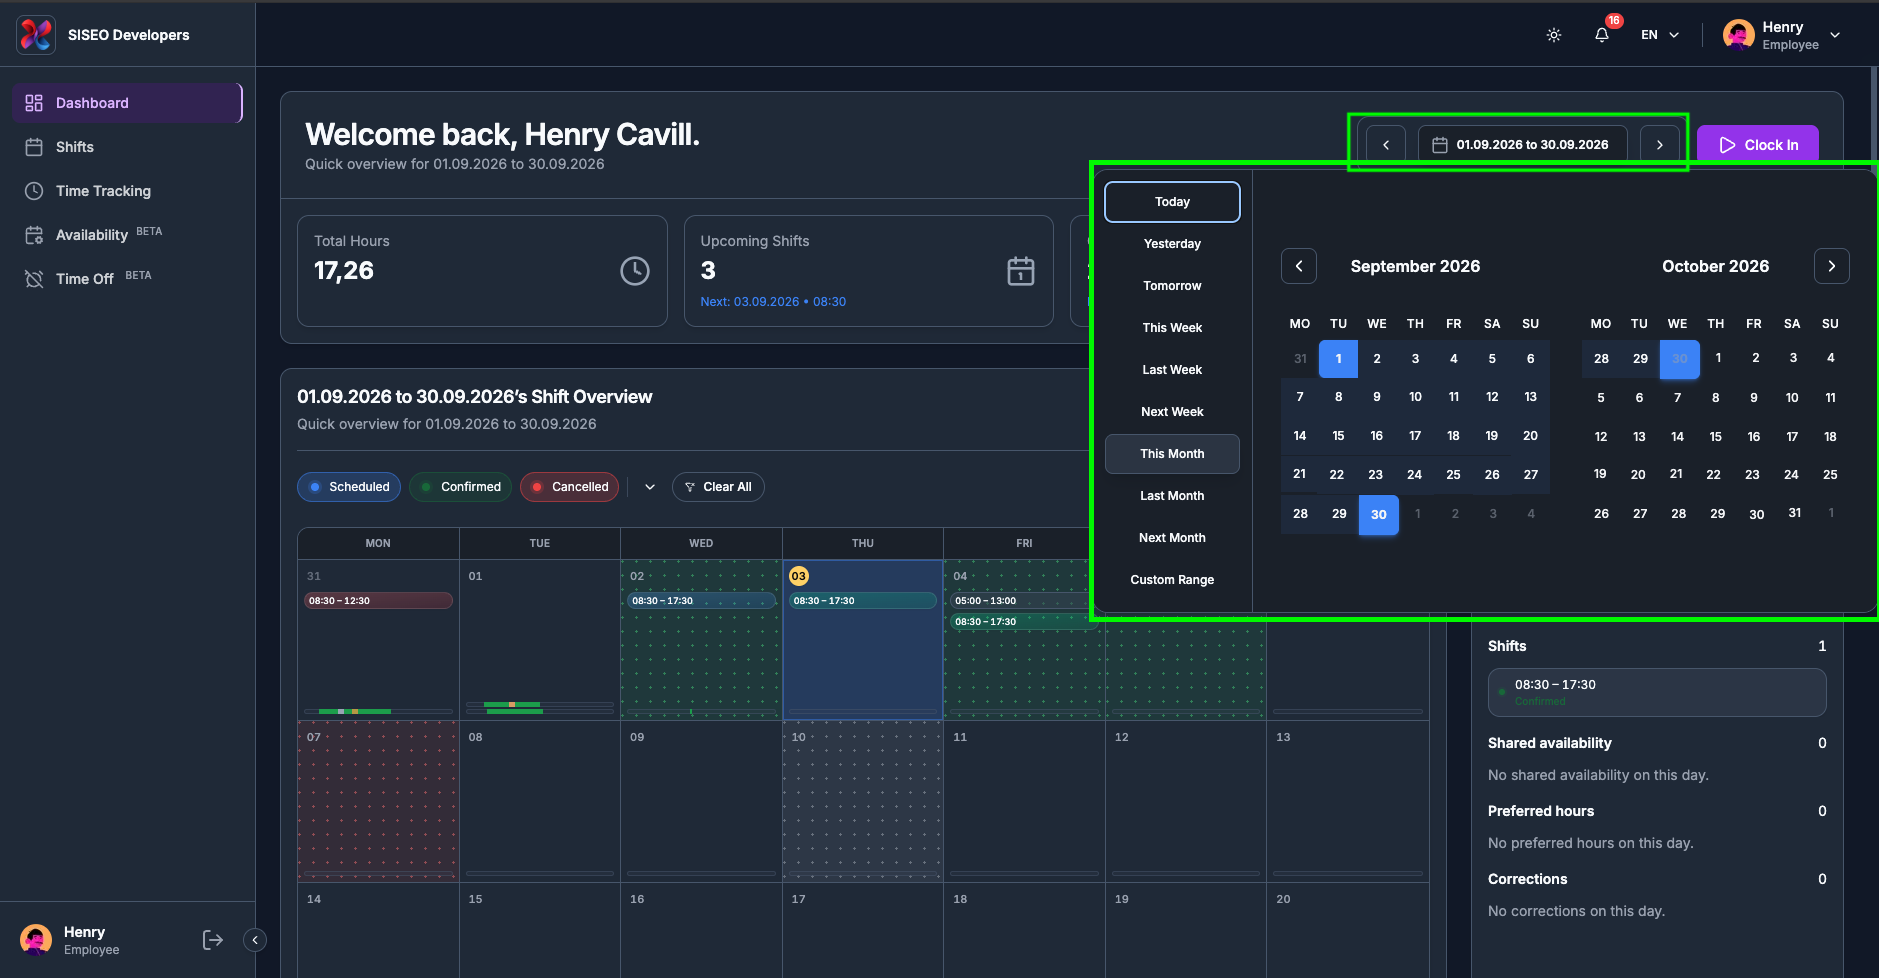
Click the date pill in the header, the button showing the current range, for example 01.09.2026 to 30.09.2026.
-
2
A panel opens with a list of quick presets on the left and a two-month calendar on the right.
1.3.2The presets
The preset list holds ten entries, in this order:
Clicking a preset applies it immediately and closes the panel. The preset you pick also decides which calendar view you get, see 2.2.1.
1.3.3How to pick a custom range
-
1
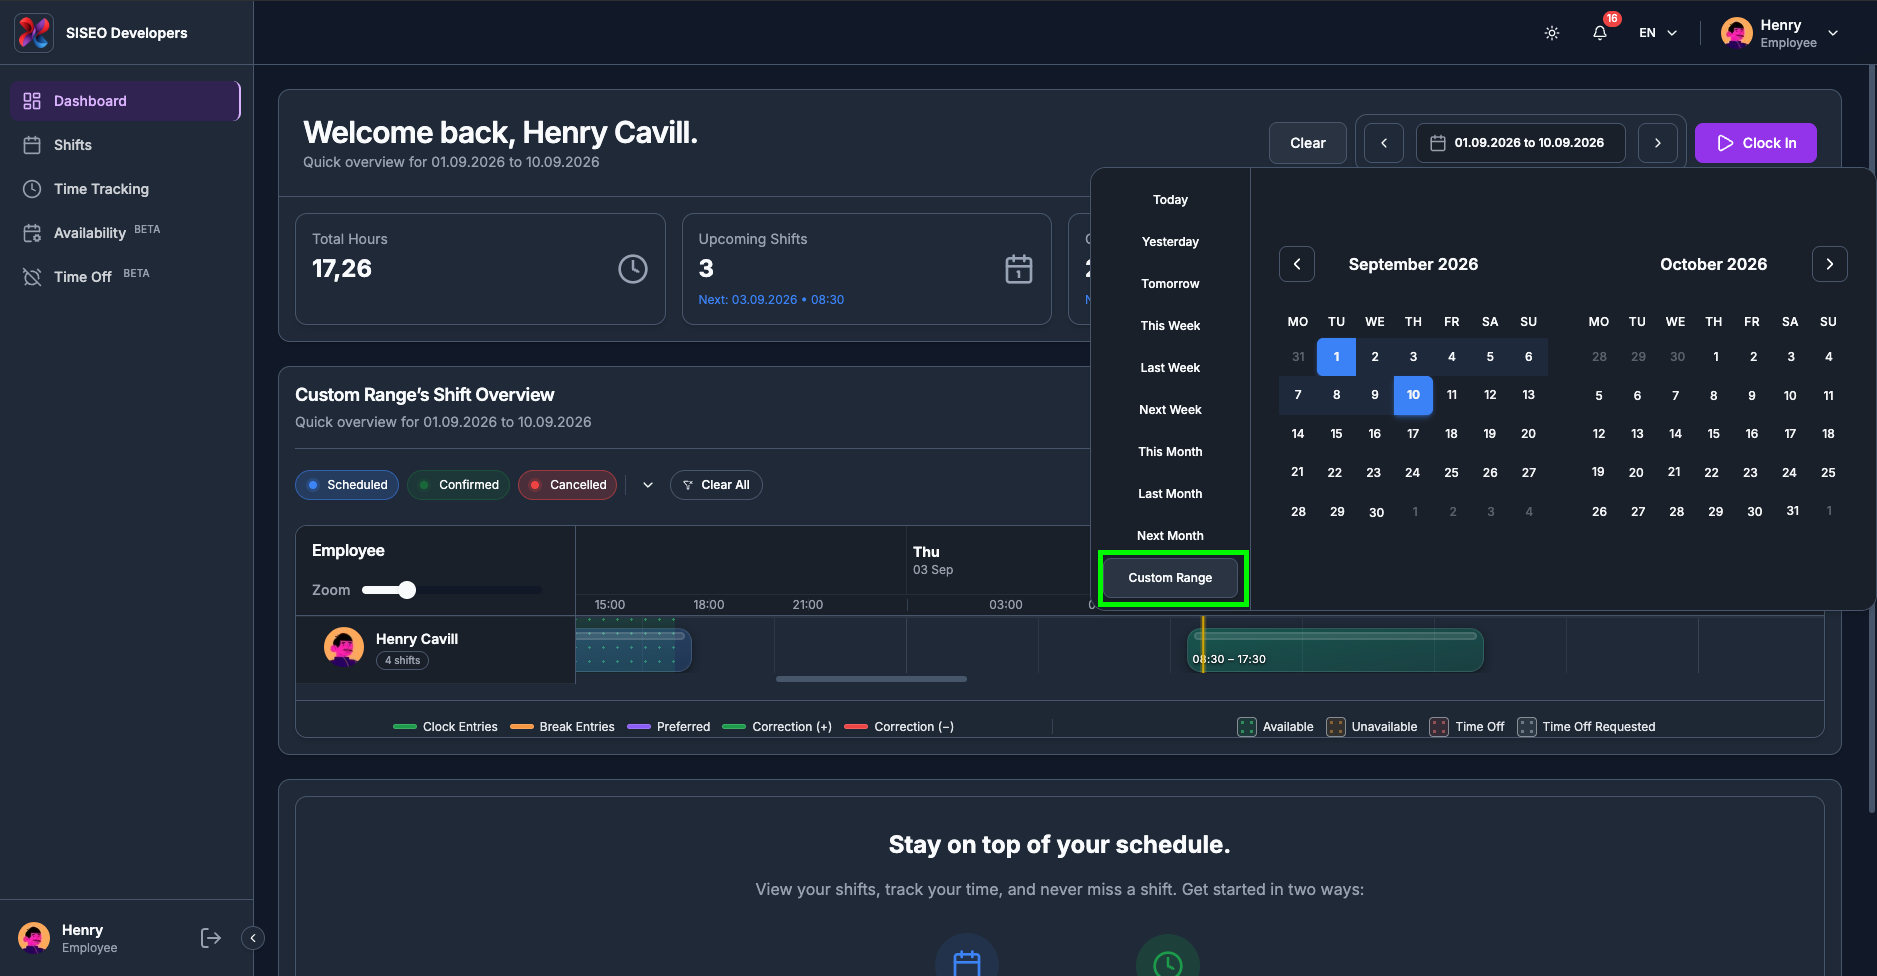
Open the date picker and click Custom Range at the bottom of the preset list. It stays highlighted to show the picker is waiting for your dates.
-
2
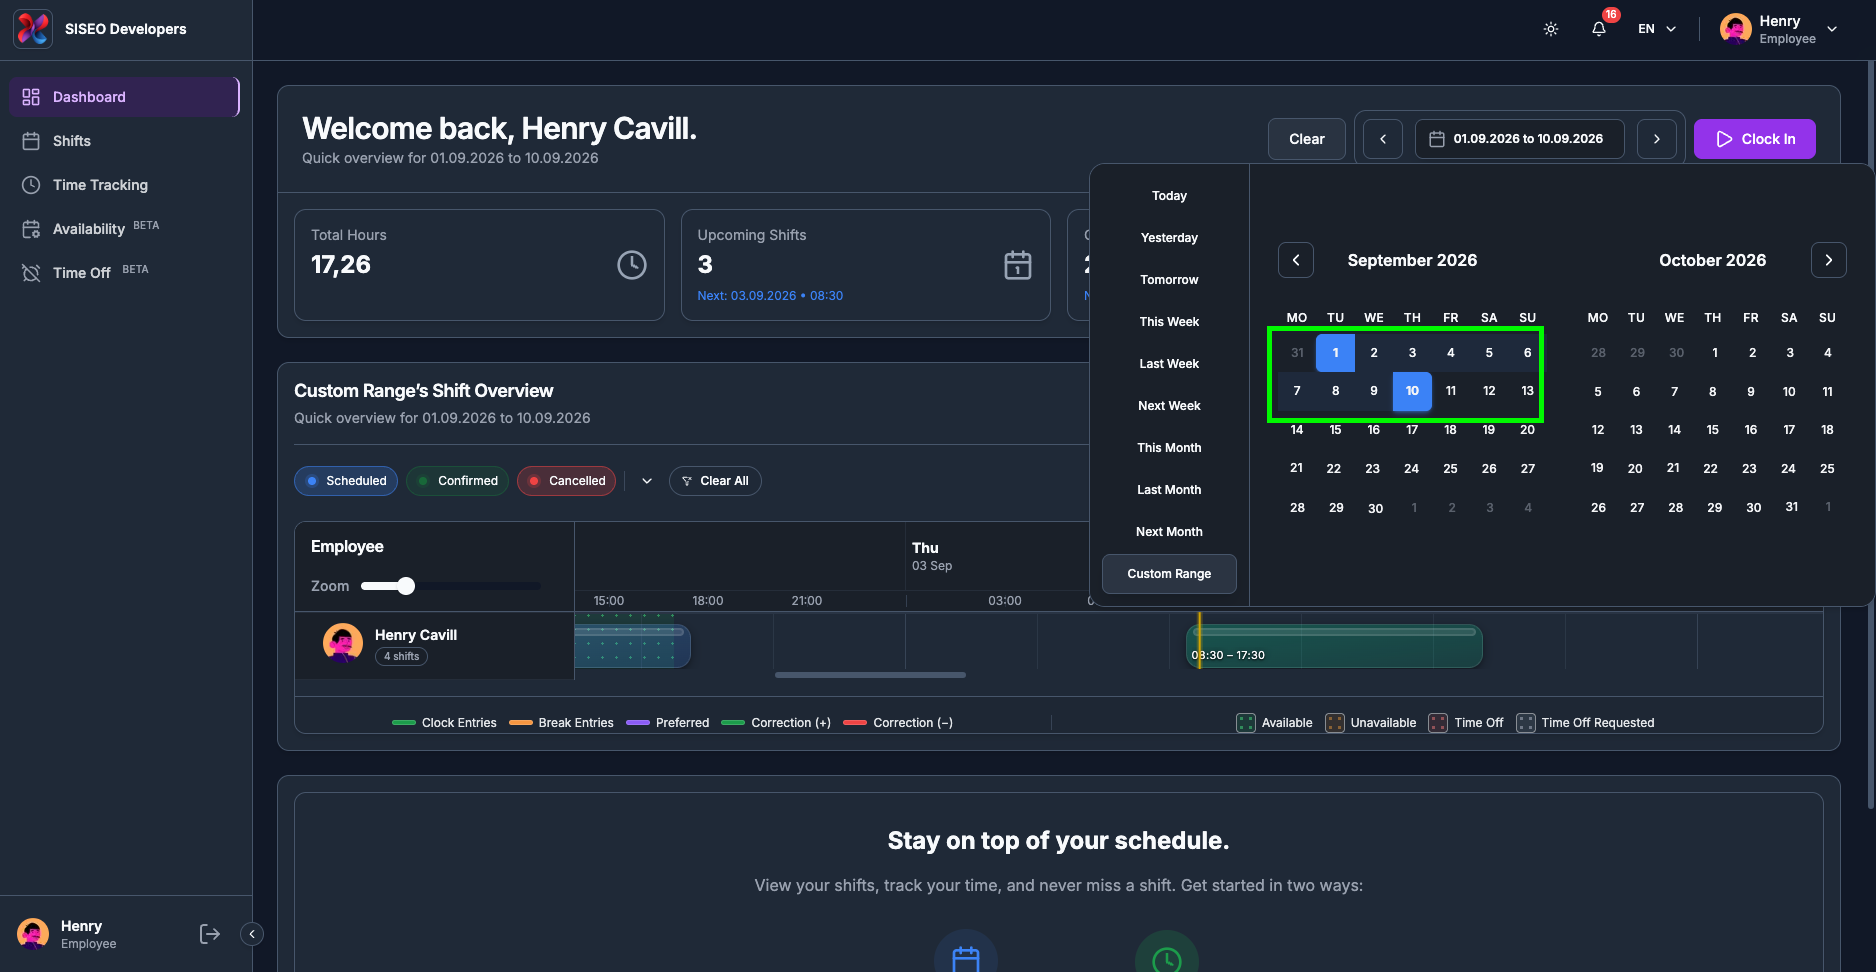
Click your start date in the calendar. It is marked, and the picker waits for the second date.
-
3
Click your end date. The range is applied and the panel closes.
Use the ‹ and › arrows above the calendar to move to earlier or later months while you are choosing, so a range can span months.
1.3.4How to step forward and back
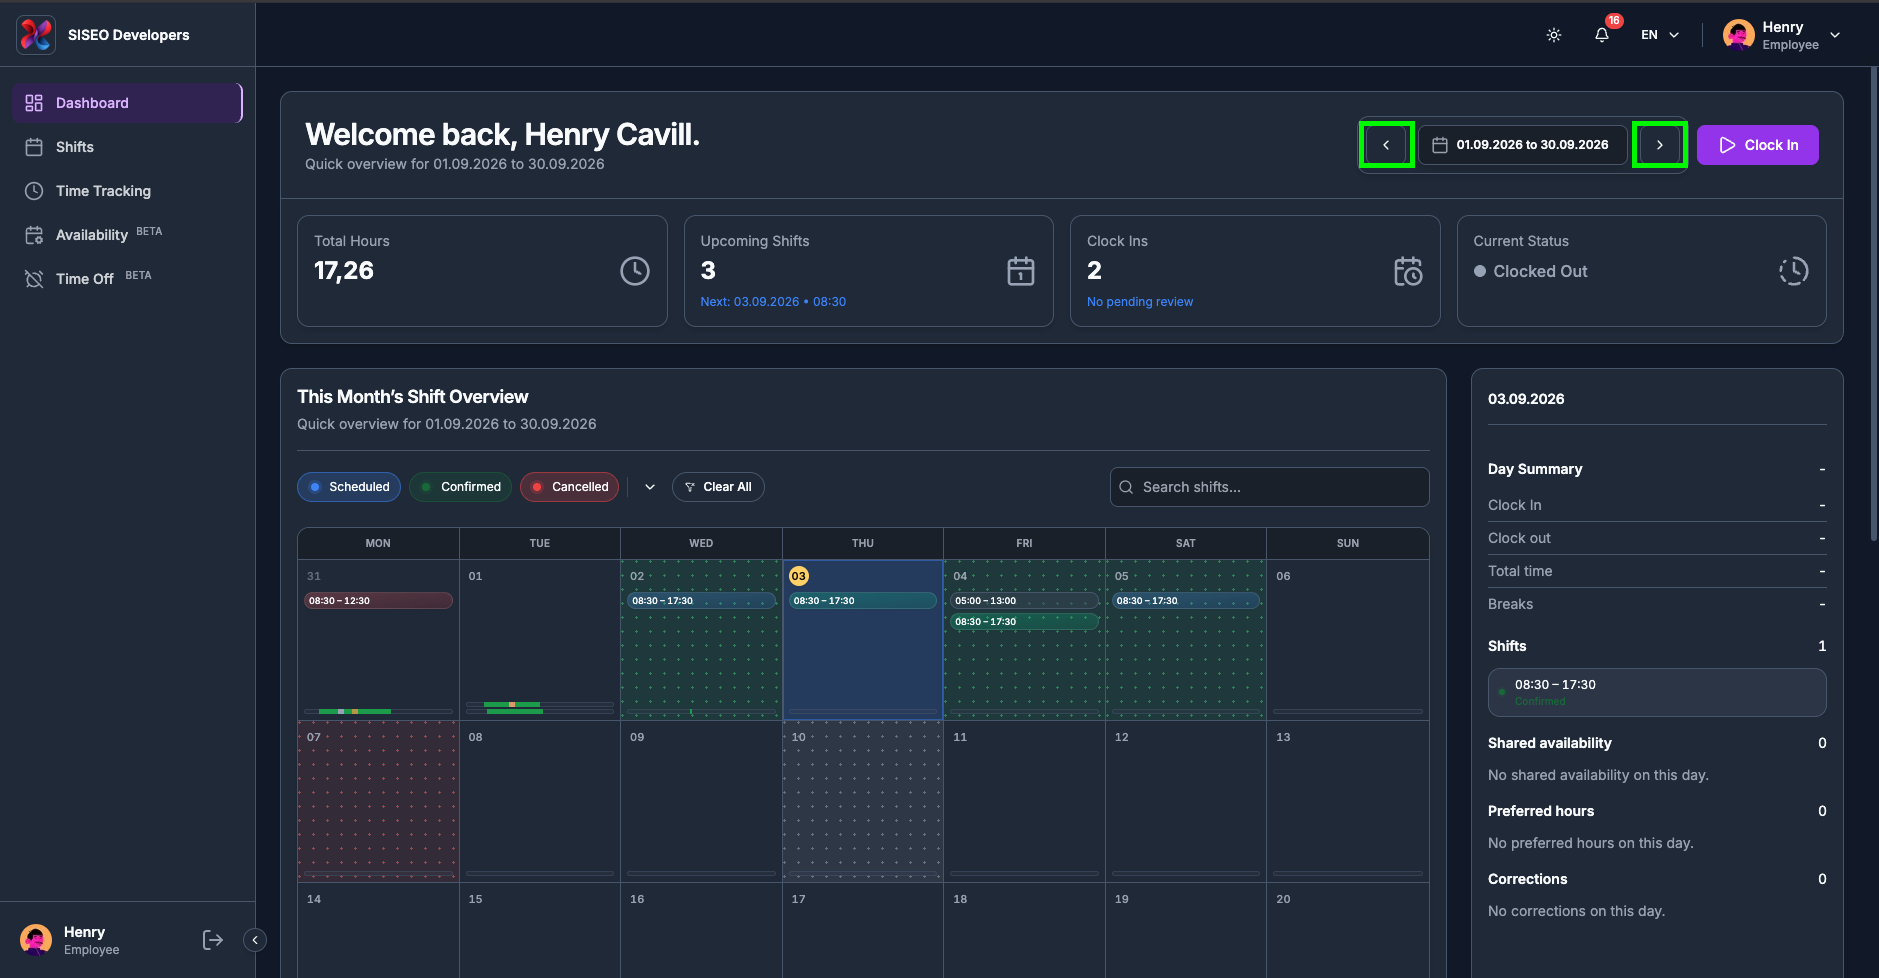
The ‹ and › arrows on either side of the date pill move the range by one step of whatever size you last chose, one day if you are on a day, one week if you are on a week, one month if you are on a month. This is the quickest way to page through your schedule without reopening the picker.
1.3.5How to get back to the default
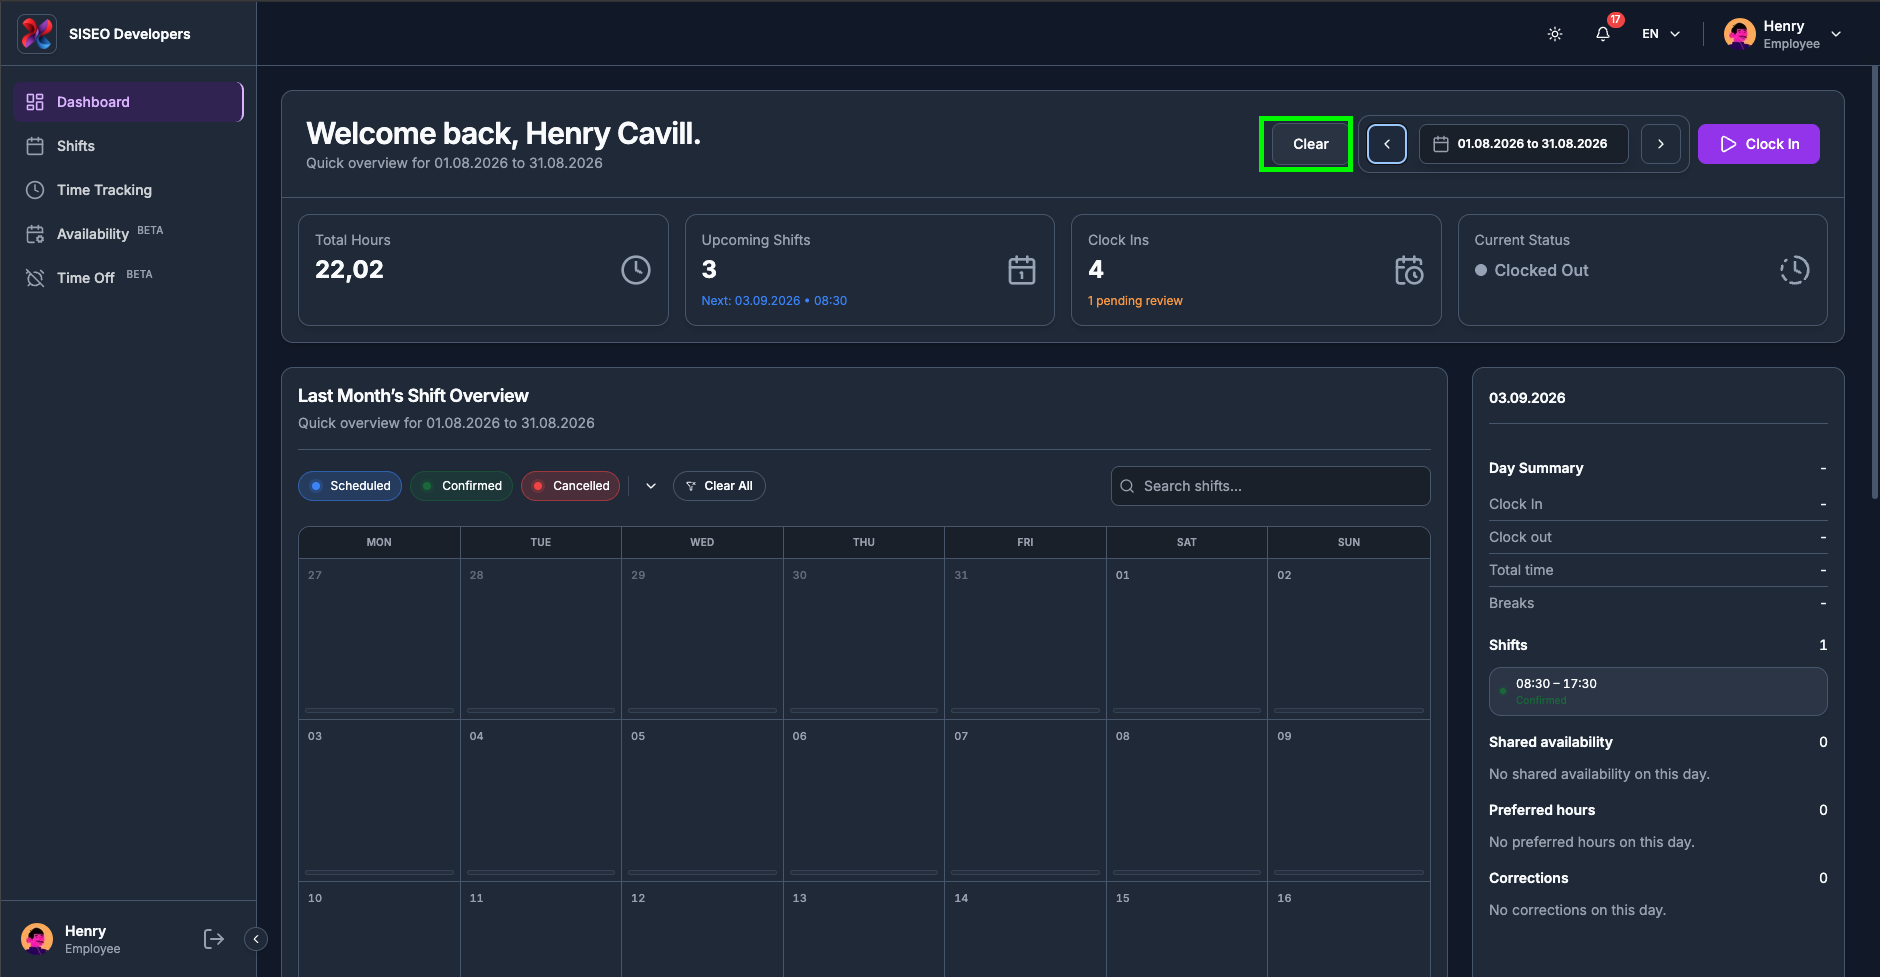
As soon as you move away from your default range, a Clear button appears to the left of the date pill. Click it to jump straight back to this month. When you are already on the default, the button is hidden, so if you cannot see it, you are already home.
1.4Clocking in and out from the Dashboard
You can start your work session directly on the dashboard. The Dashboard header carries the same clock controls, and anything you do here shows up on the Time Tracking page straight away.
1.4.1How to clock in
-
1
Click the Clock In button at the far right of the header.
-
2
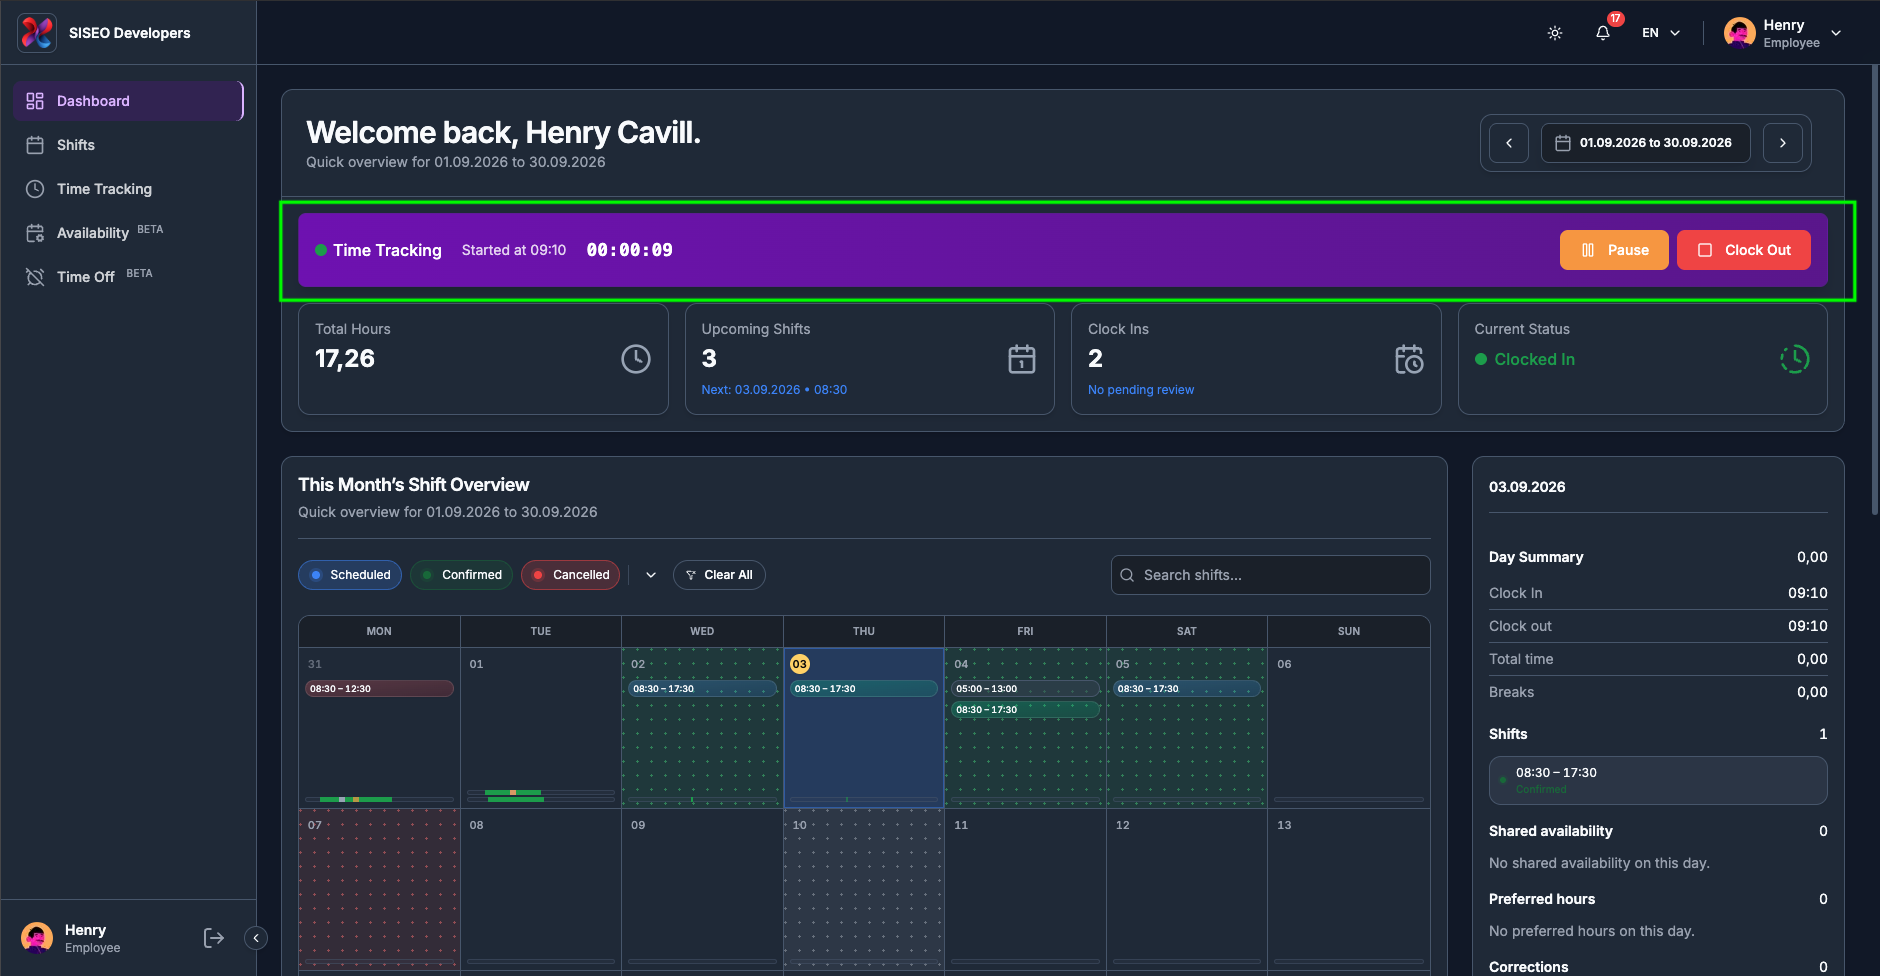
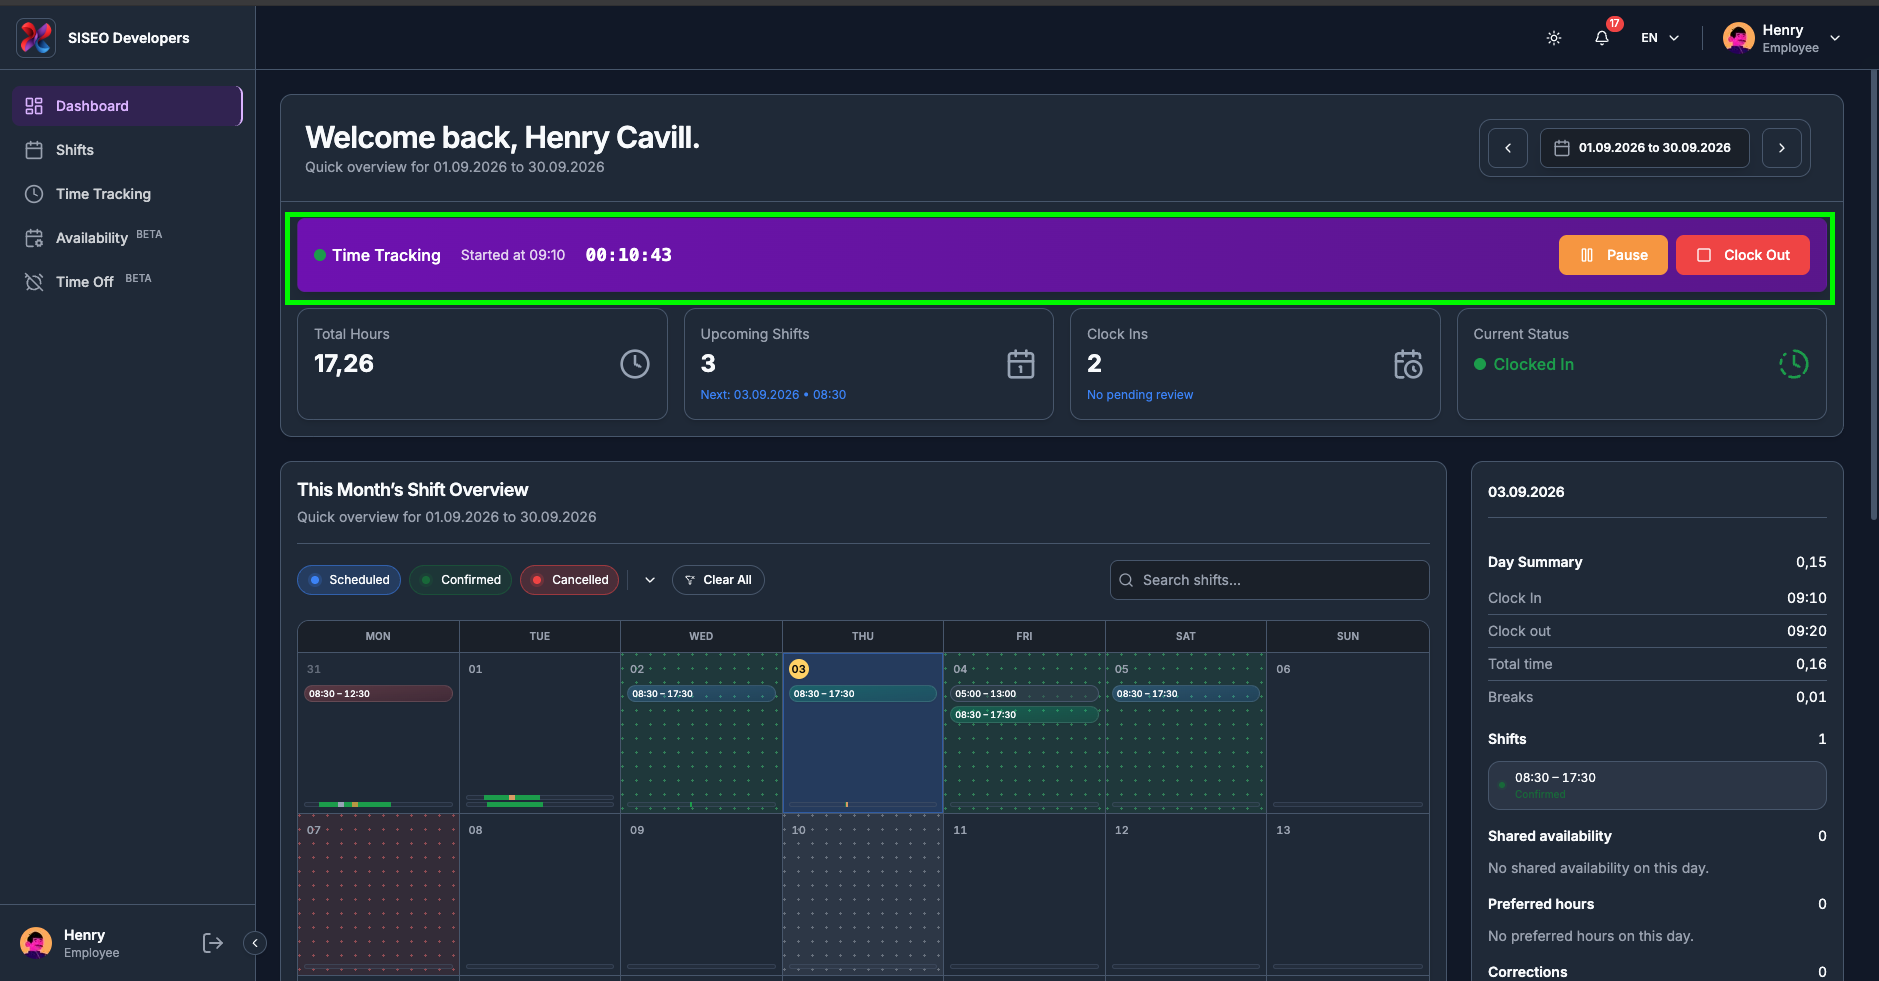
Your session starts. A purple session ribbon appears under the header, Current Status changes to Clocked In, and the button is replaced by Pause and Clock Out.
1.4.2Reading the session ribbon
While a session is running, the ribbon under the header shows, from left to right:
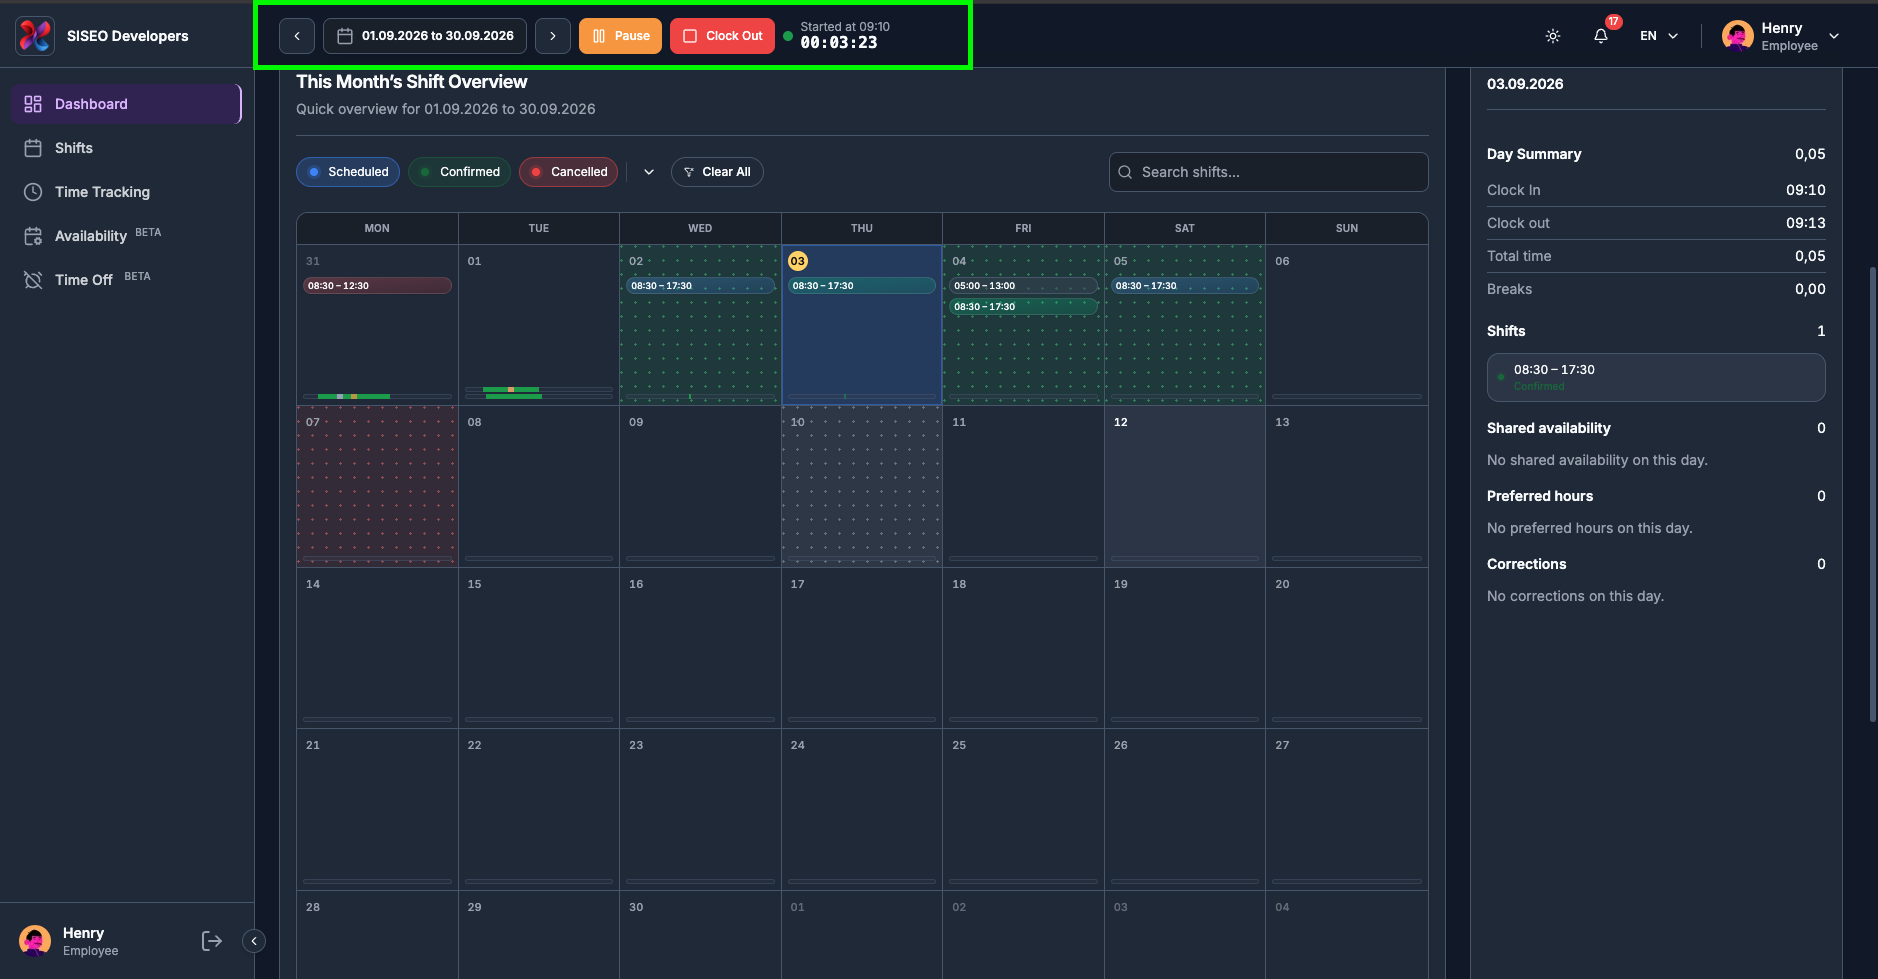
If you scroll down the page, the header collapses into the top bar and the timer travels with it, so you can always see how long you have been working.
1.4.3How to start a break
-
1
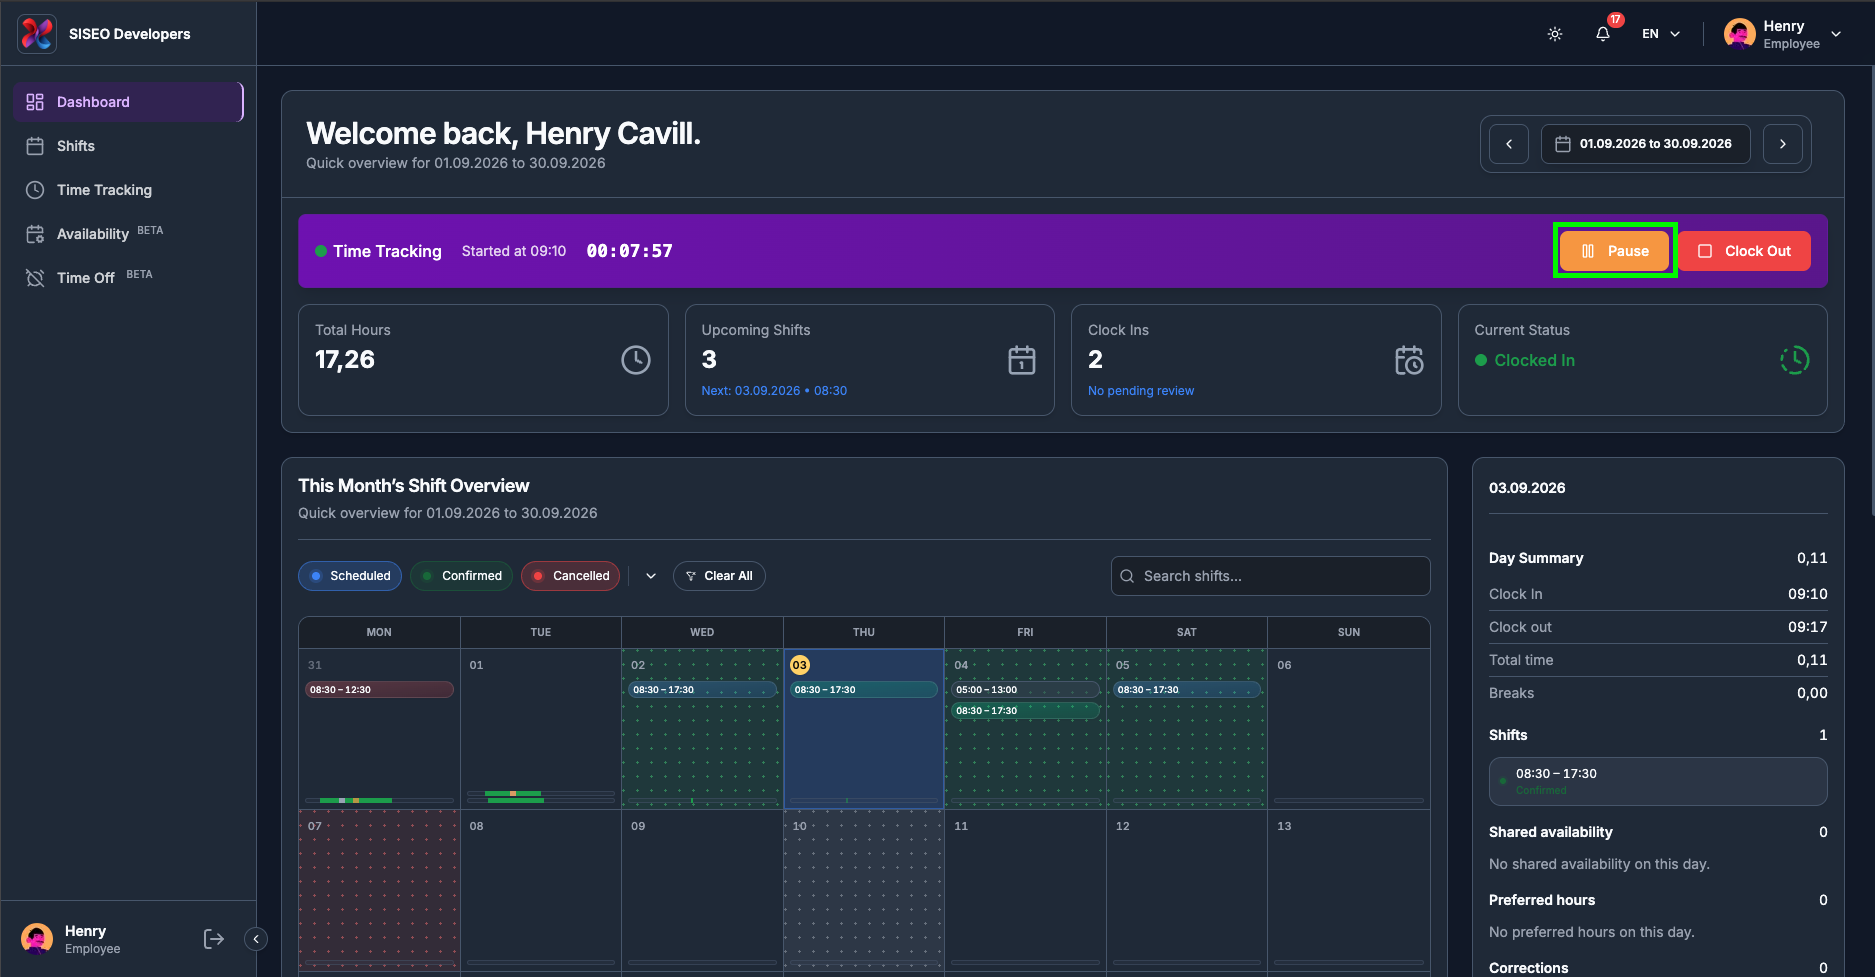
Click Pause in the session ribbon.
-
2
An On Break badge appears, the status dot turns amber, Current Status changes to On Break, and Pause becomes Resume. Your session stays open, but the break time will not be counted as worked time.
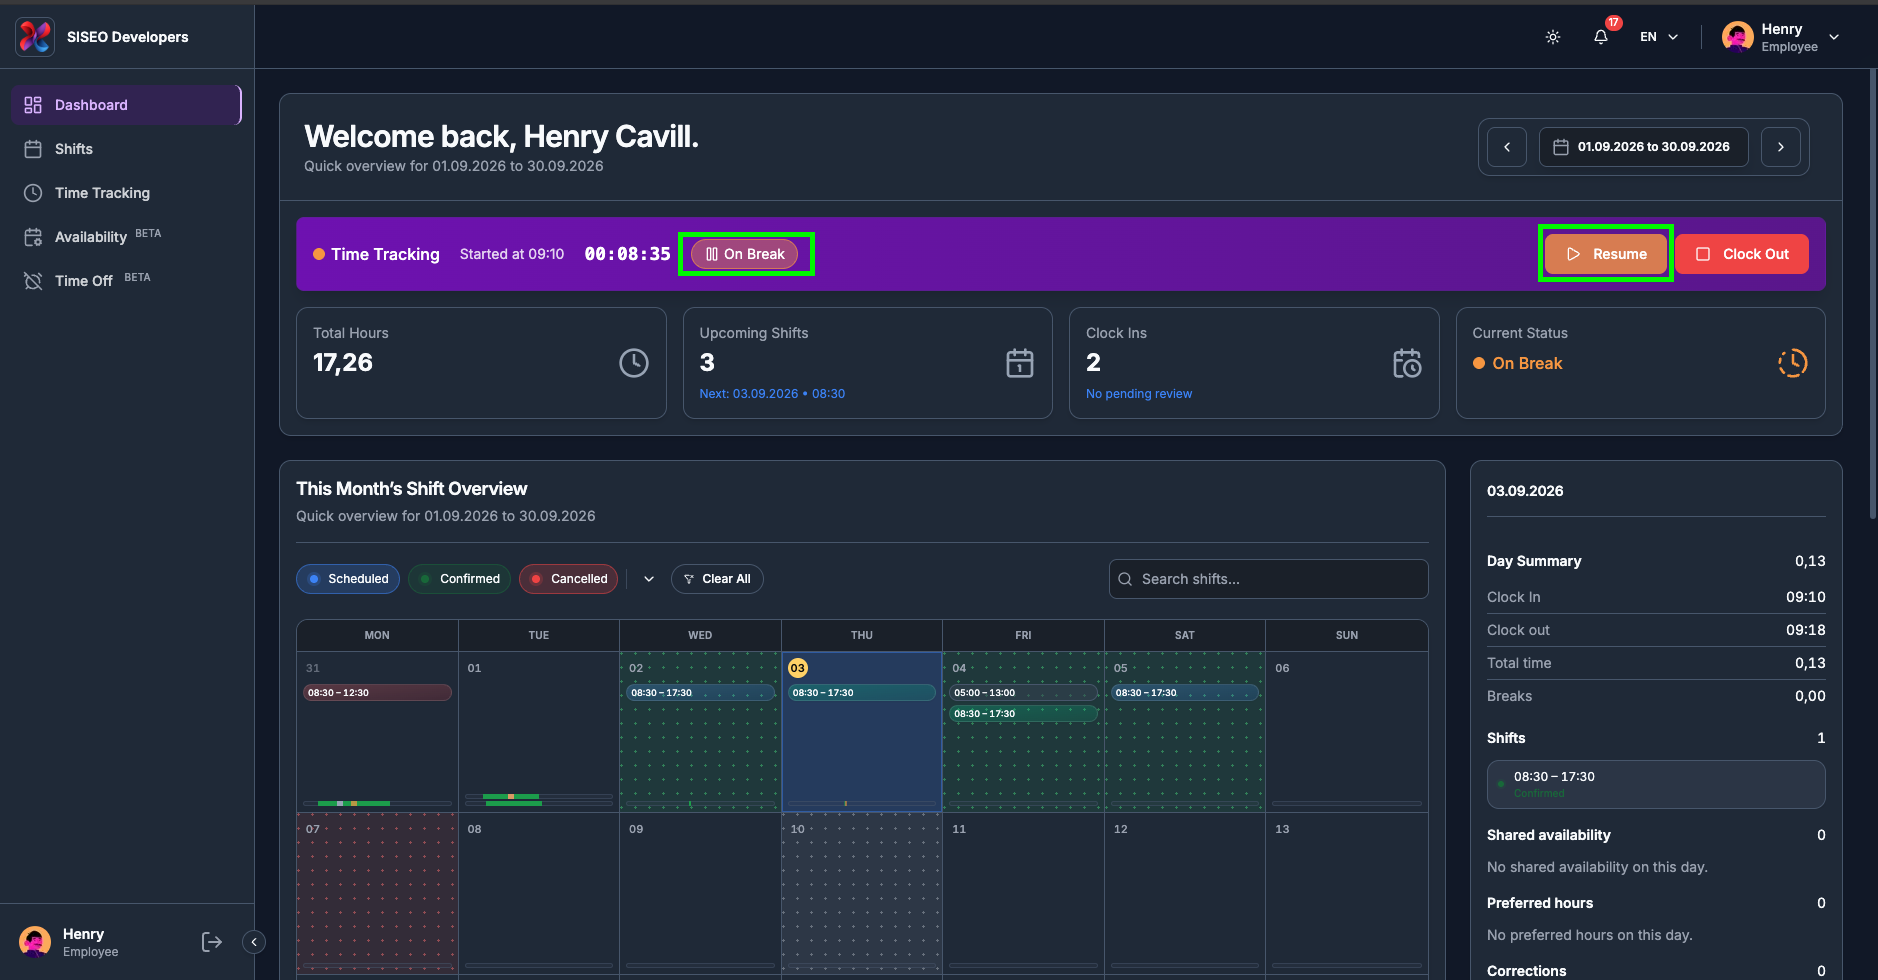
1.4.4How to end a break
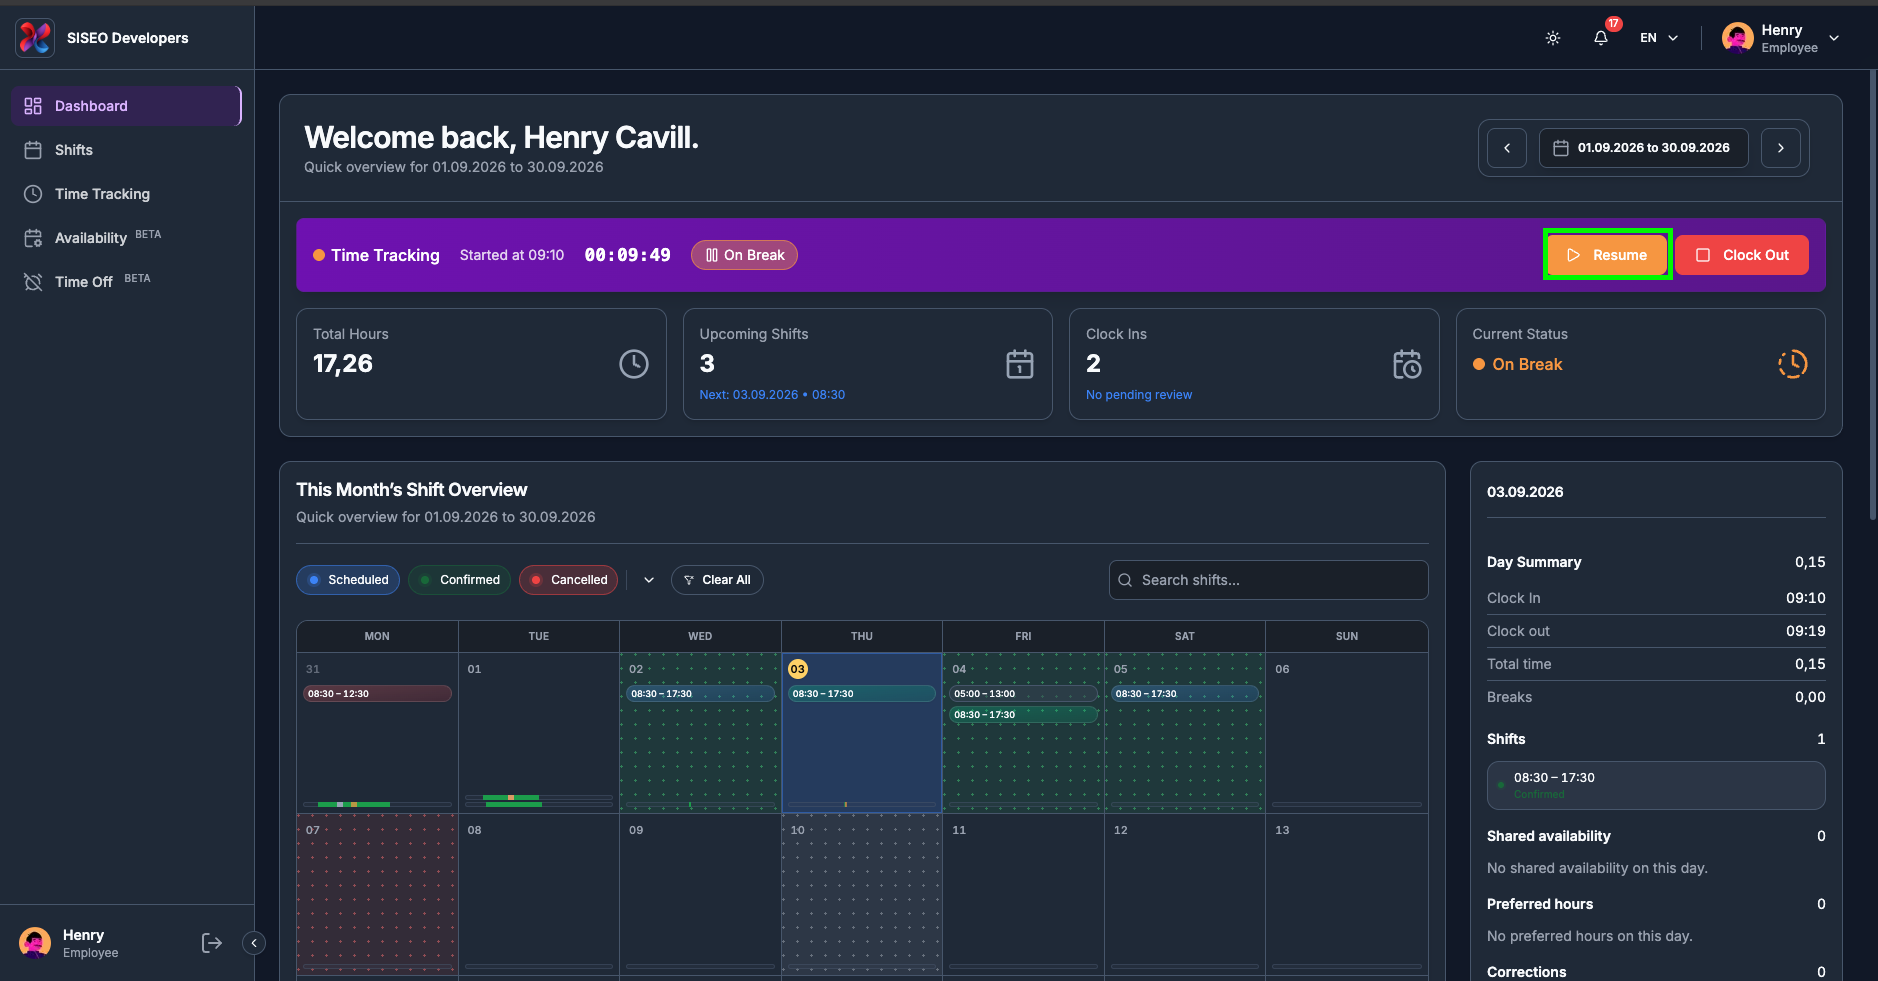
-
1
Click Resume.
-
2
The On Break badge disappears, the dot turns green again, Current Status goes back to Clocked In, and the button returns to Pause.
1.4.5How to clock out
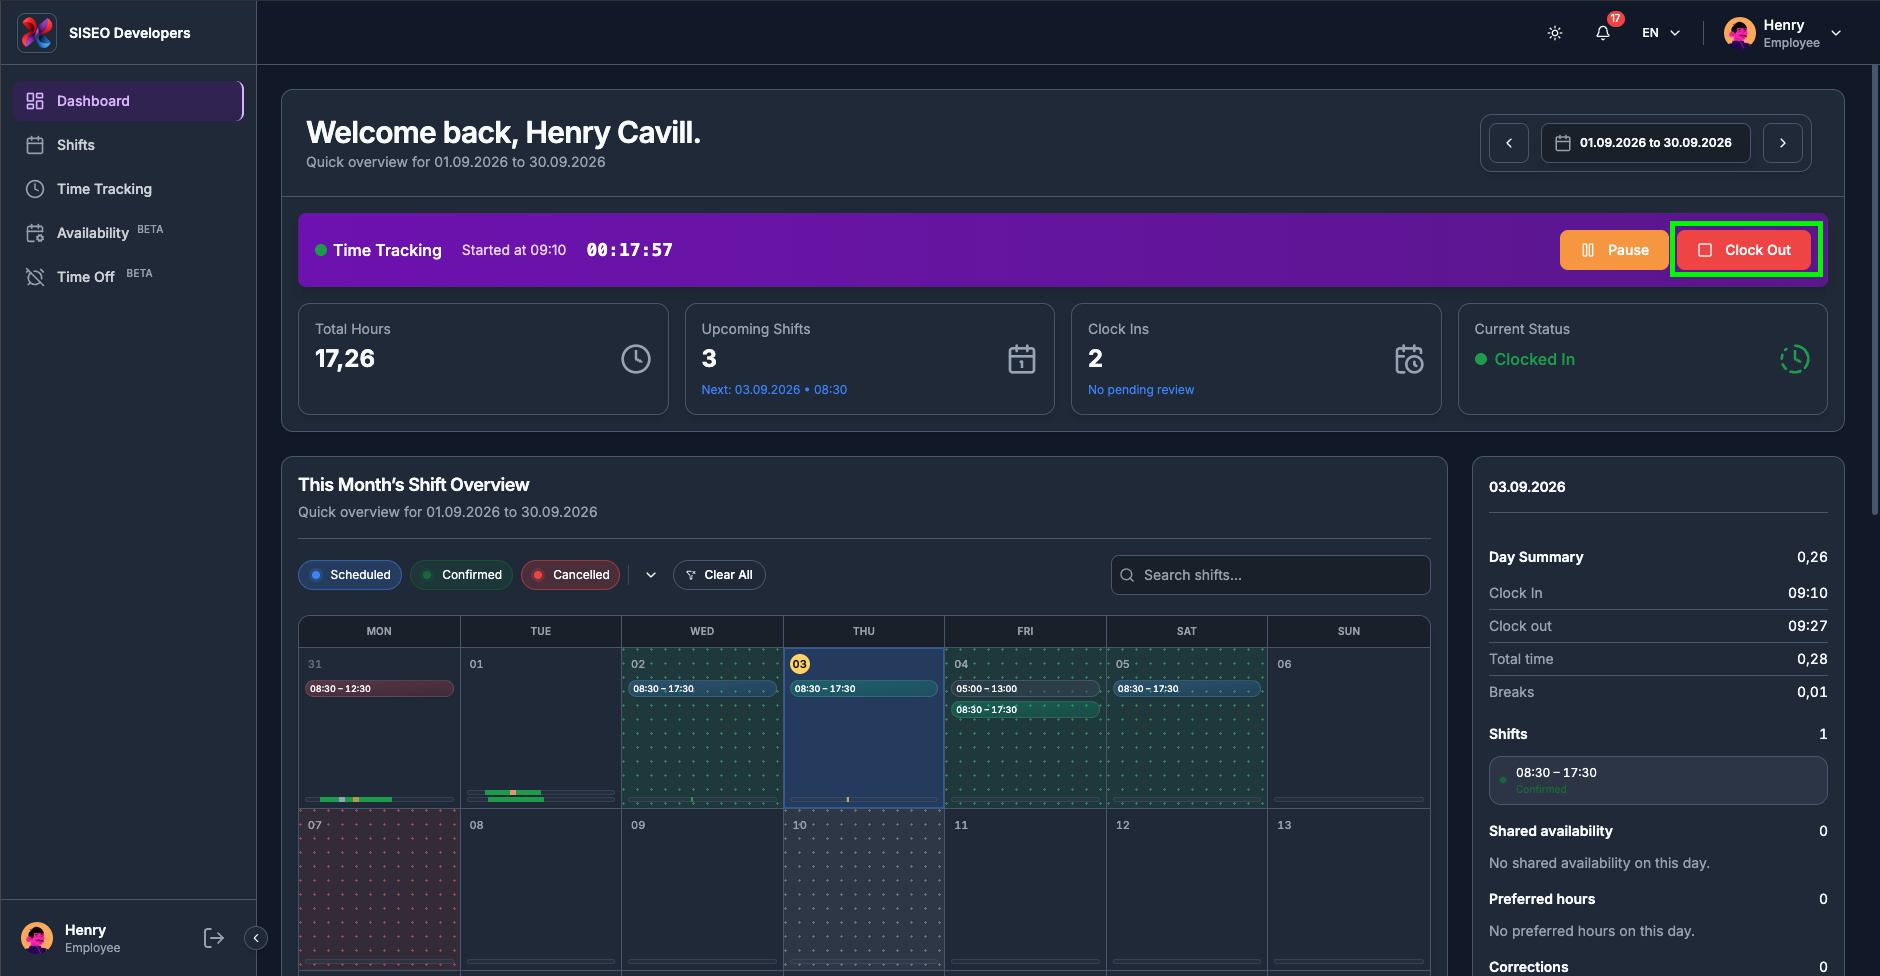
-
1
Click Clock Out in the session ribbon.
-
2
The session ends. The ribbon and timer disappear, Current Status returns to Clocked Out, and the Clock In button comes back. Your Total Hours and Clock Ins cards update to include the session you just finished.
1.5Filtering the Shift Overview
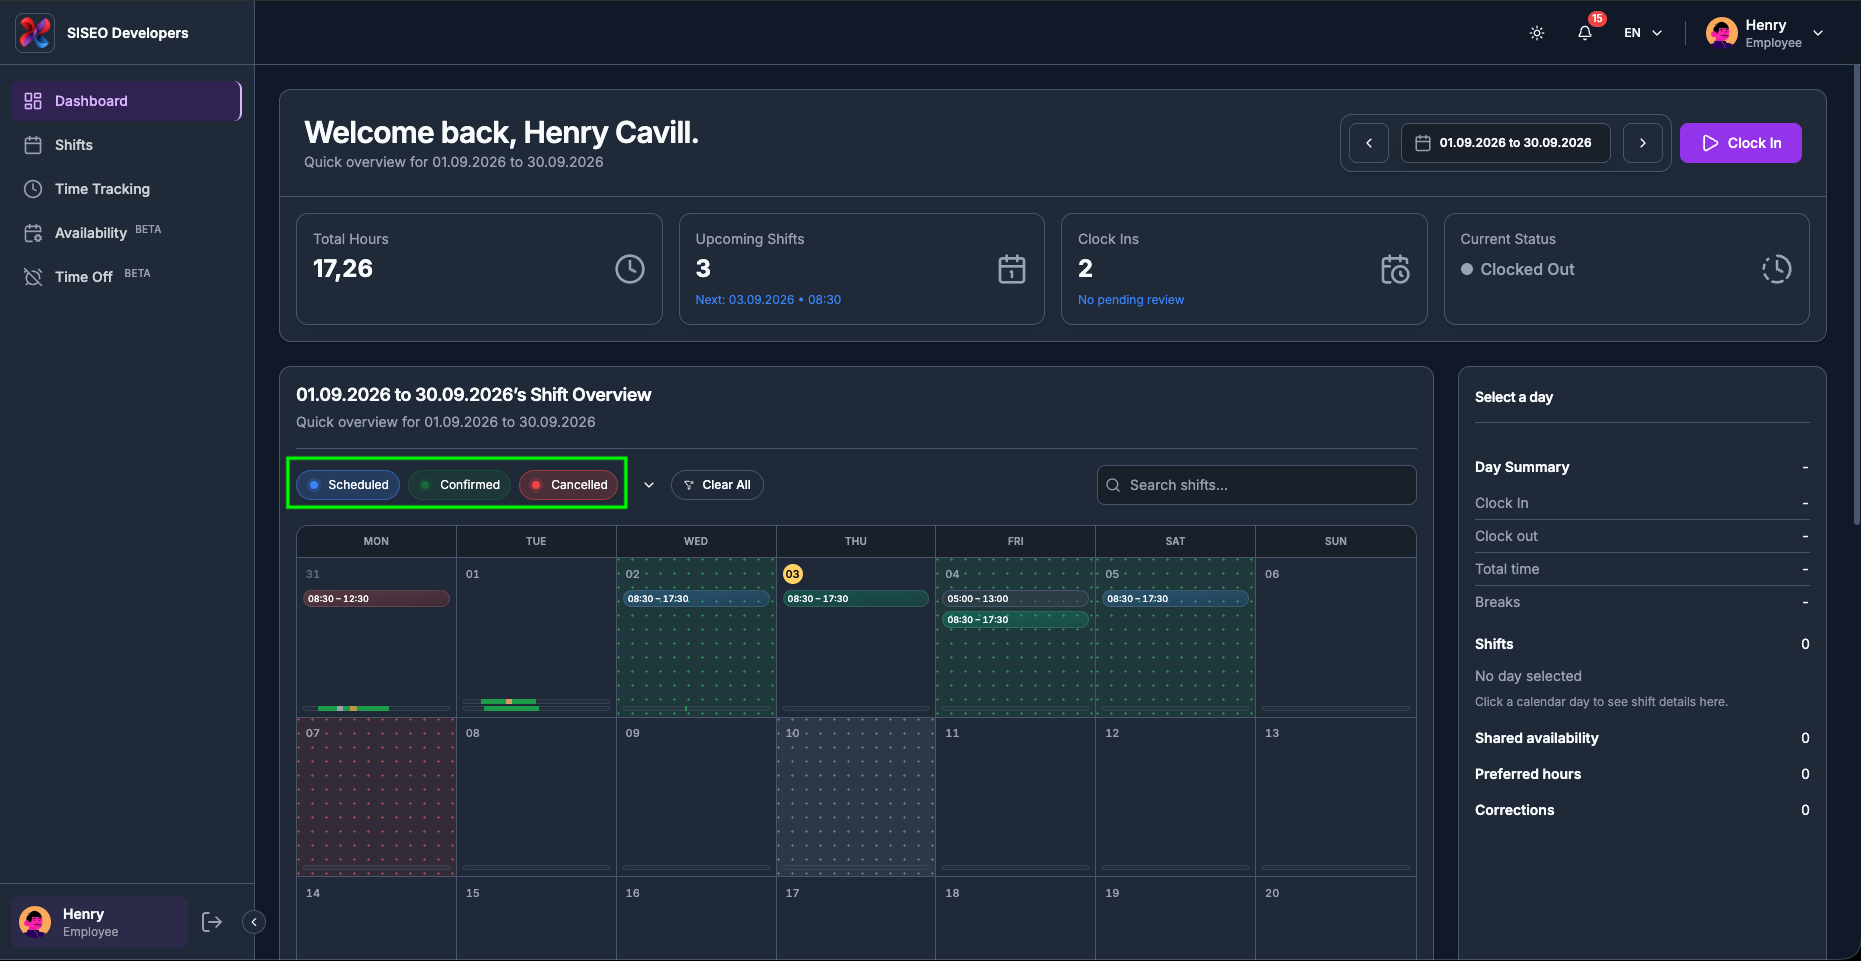
The calendar card is titled <your date range>’s Shift Overview and carries a filter row above the calendar. These filters change only what the calendar draws; they do not change the stat cards.
1.5.1How to filter by shift status
Three chips control which shifts are drawn. Each is a toggle, click to switch it on or off:
With none touched, all three are shown. Draft and planned shifts your manager is still working on never appear here.
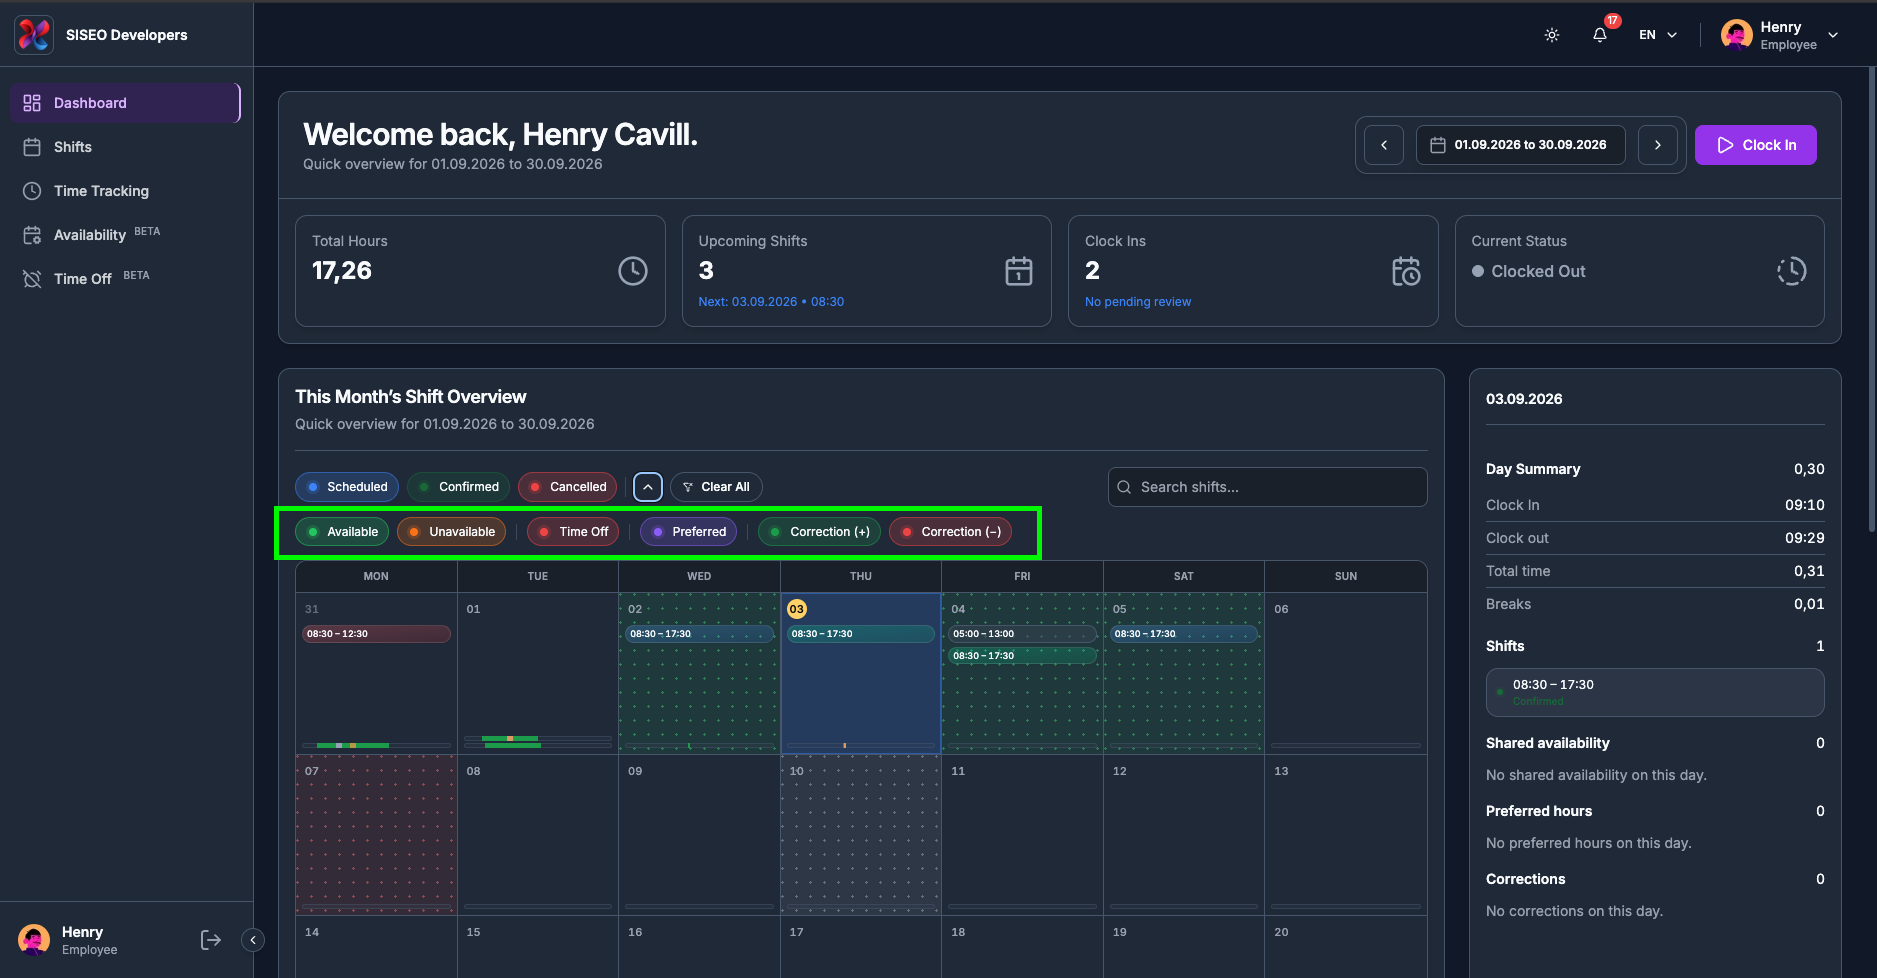
1.5.2How to show the availability and correction filters
-
1
Click the small chevron just after the Cancelled chip.
-
2
A second row of chips appears. Click the chevron again to hide it.
The second row holds:
Switching one of these off removes that layer from the calendar. What each layer actually looks like in a day cell is covered in 2.2.6 to 2.2.11.
1.5.3How to search your shifts
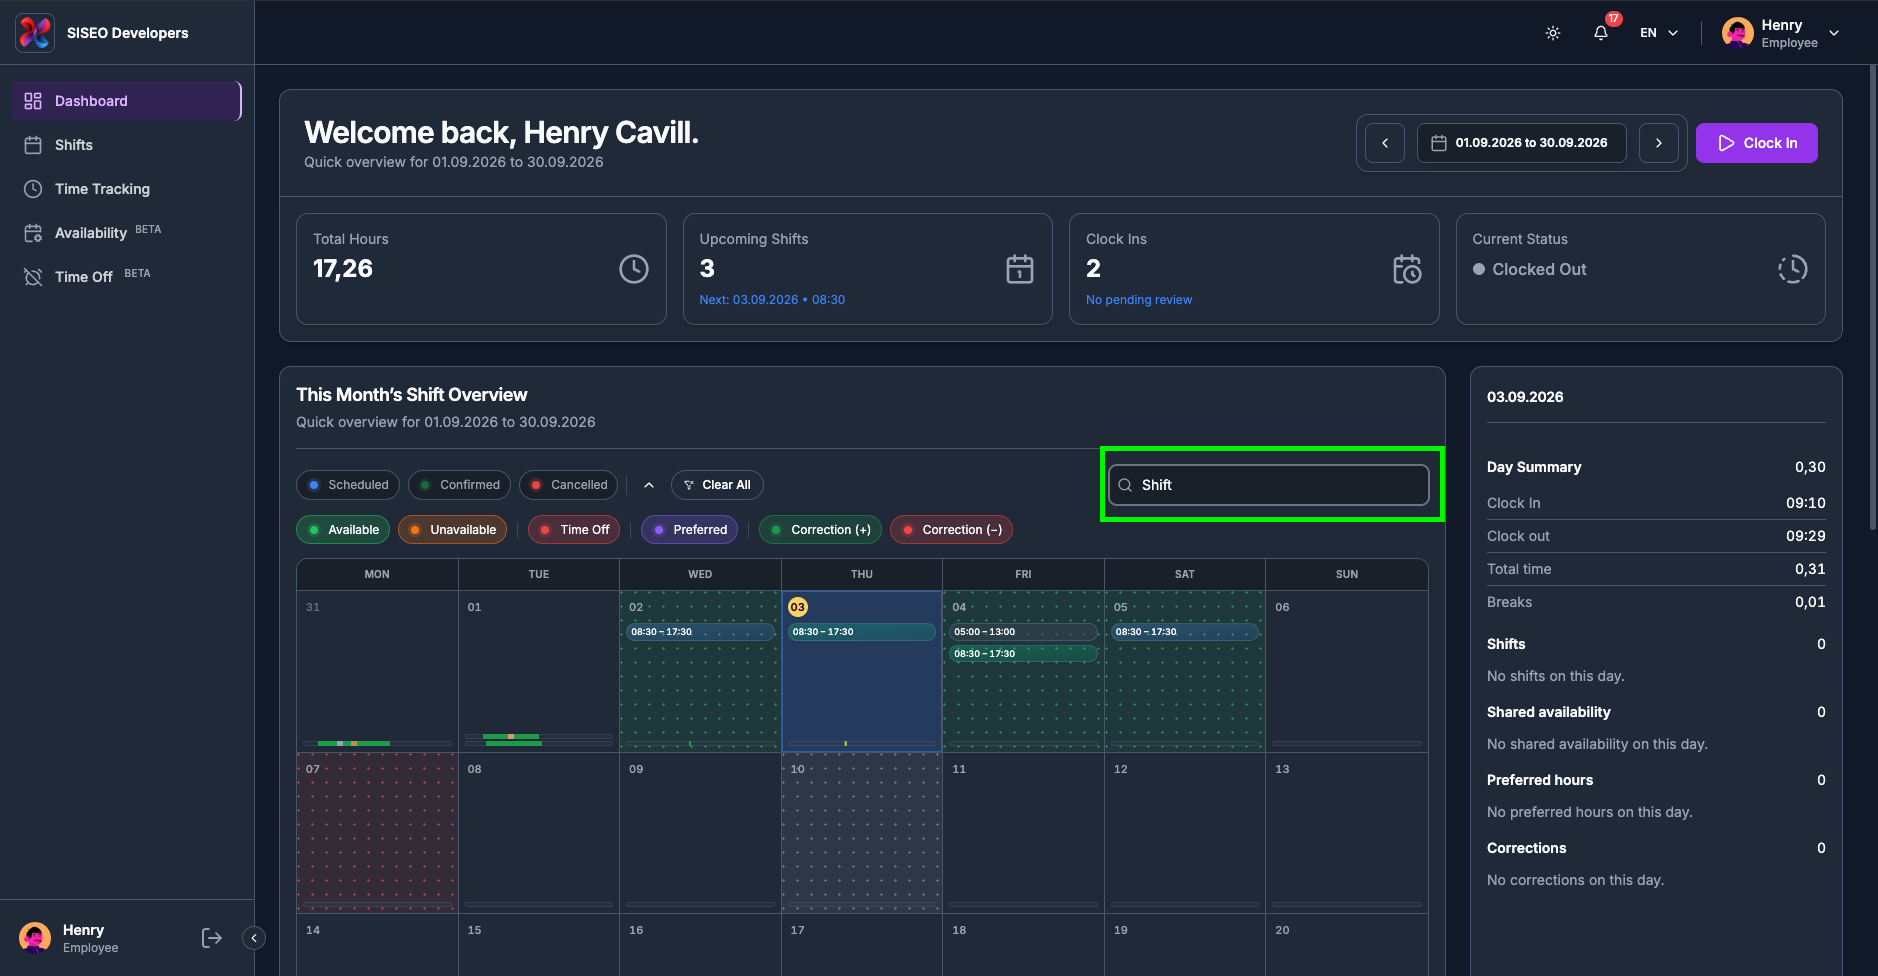
Type into the Search shifts… box on the right of the filter row to narrow the calendar to shifts whose title matches what you type. The search works on top of the date range and the chips, not instead of them, so an empty calendar usually means the shift you are hunting for is outside the current range.
1.5.4How to reset the filters
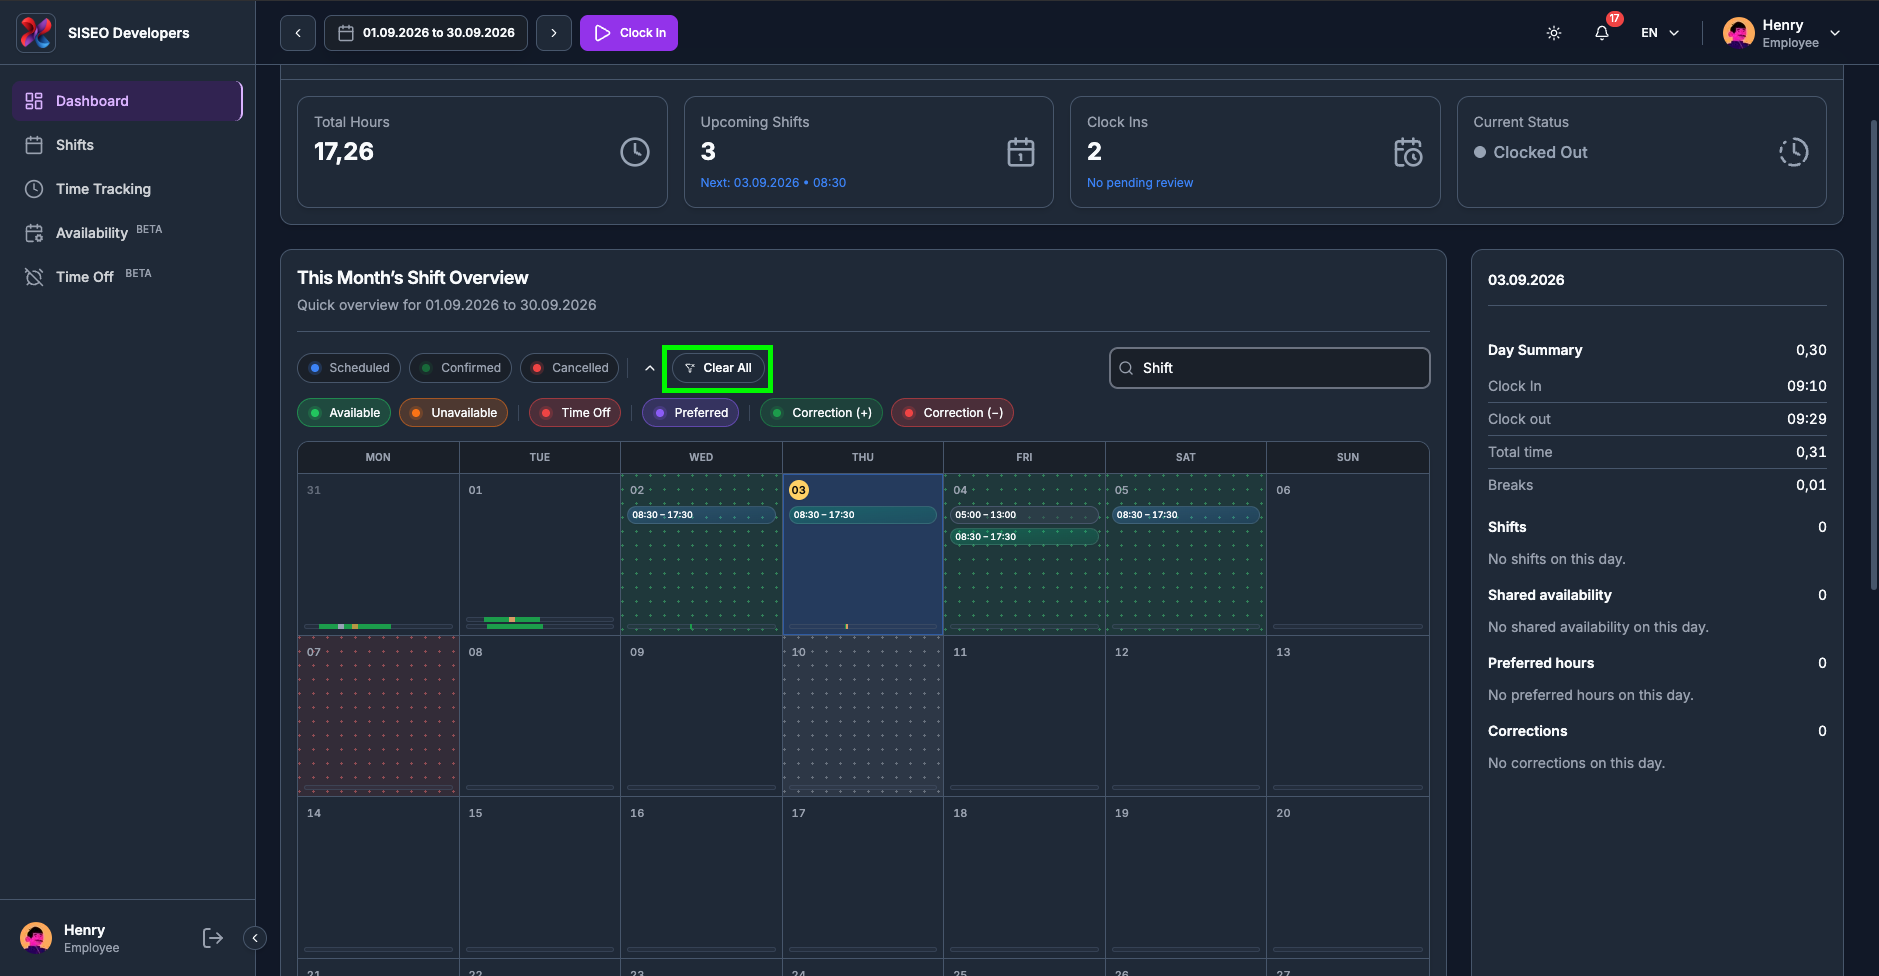
As soon as any filter is active, a chip toggled, or text in the search box, a Clear All button appears at the end of the chip row. One click returns every chip and the search box to their starting state. It does not touch your date range; use Clear next to the date pill for that (2.2.5).
1.6Calendar views
1.6.1How the view is chosen
There is no Month / Week / Day switcher. The calendar picks its own shape from the date range you selected in 2.4, and the card title changes to match:
| Preset you pick | View you get | Card title |
|---|---|---|
| Today, Yesterday, Tomorrow | Day | “Today’s Shift Overview”, and so on |
| This / Last / Next Week | Week | “This Week’s Shift Overview”, and so on |
| This / Last / Next Month | Month | The date range, e.g. “01.09.2026 to 30.09.2026’s Shift Overview” |
| Custom Range | Timeline (Gantt) | The date range you chose |
All four show the same underlying information, shifts, availability, preferred hours, recorded working time and corrections, just at different zoom levels.
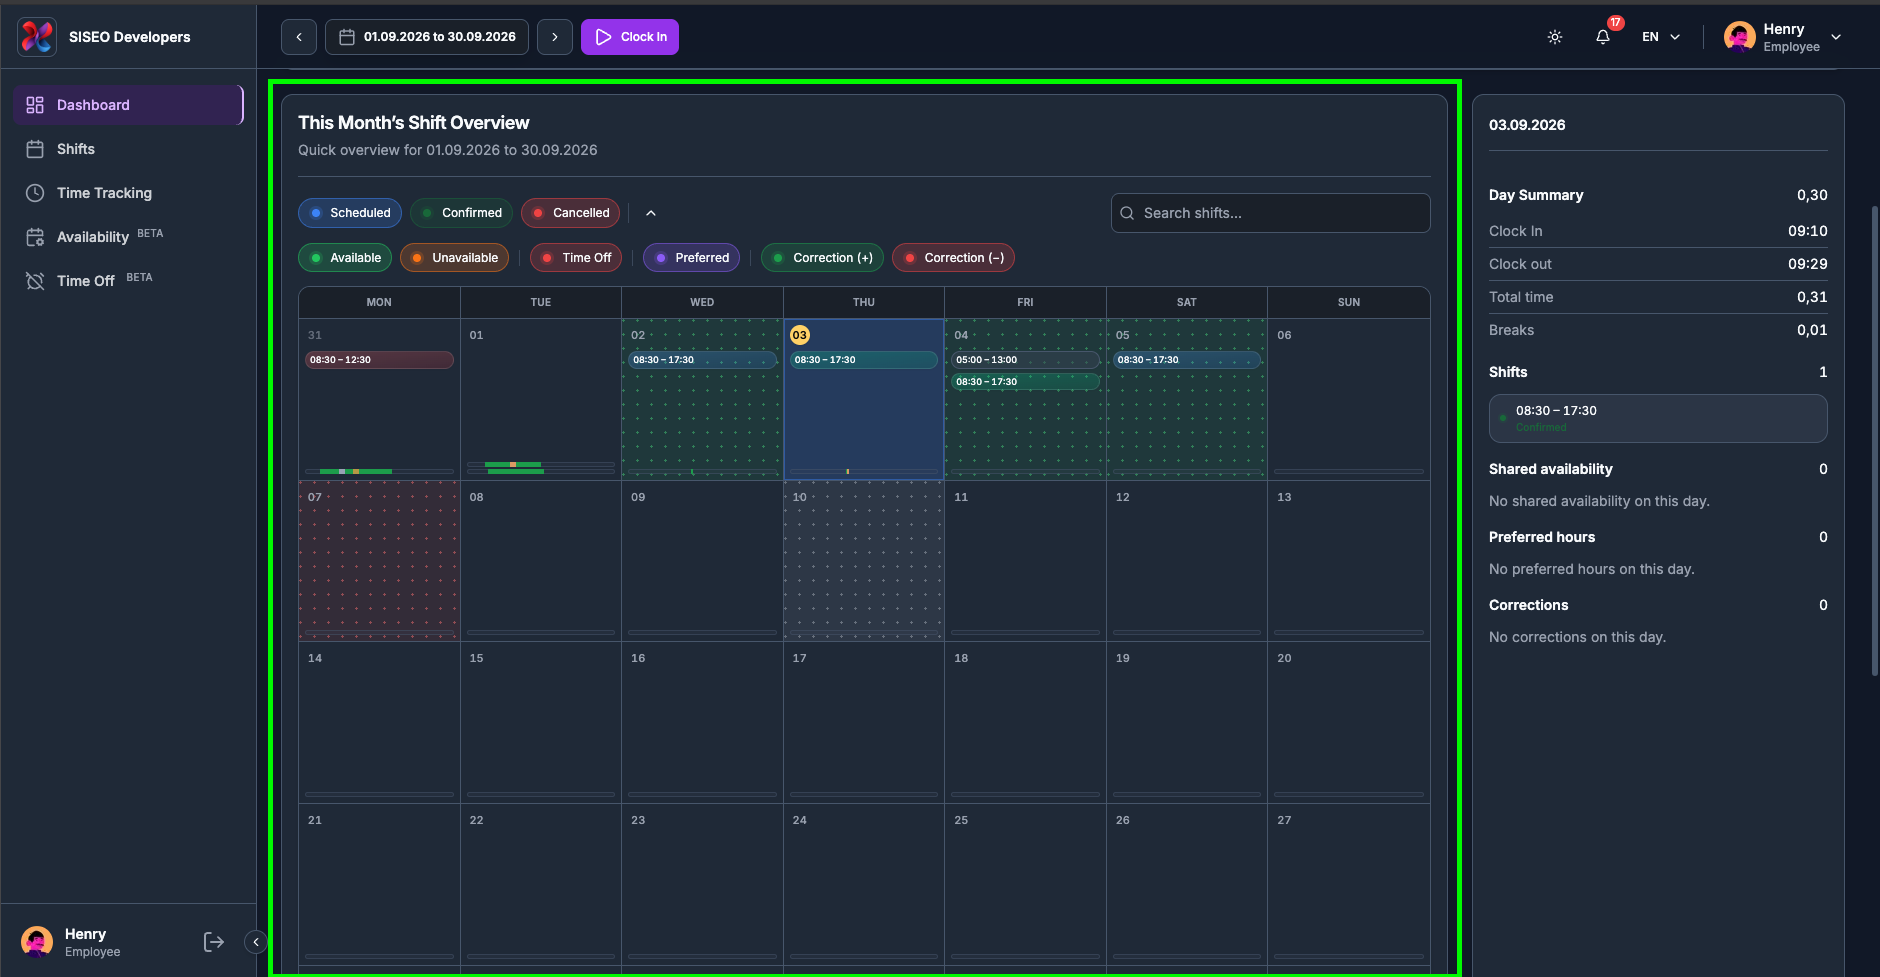
1.6.2Month view
A grid of whole weeks running Monday to Sunday. To keep the weeks complete, the first and last rows include a few greyed-out days from the neighbouring months. Today carries a highlighted date badge, and the day you have selected is shaded.
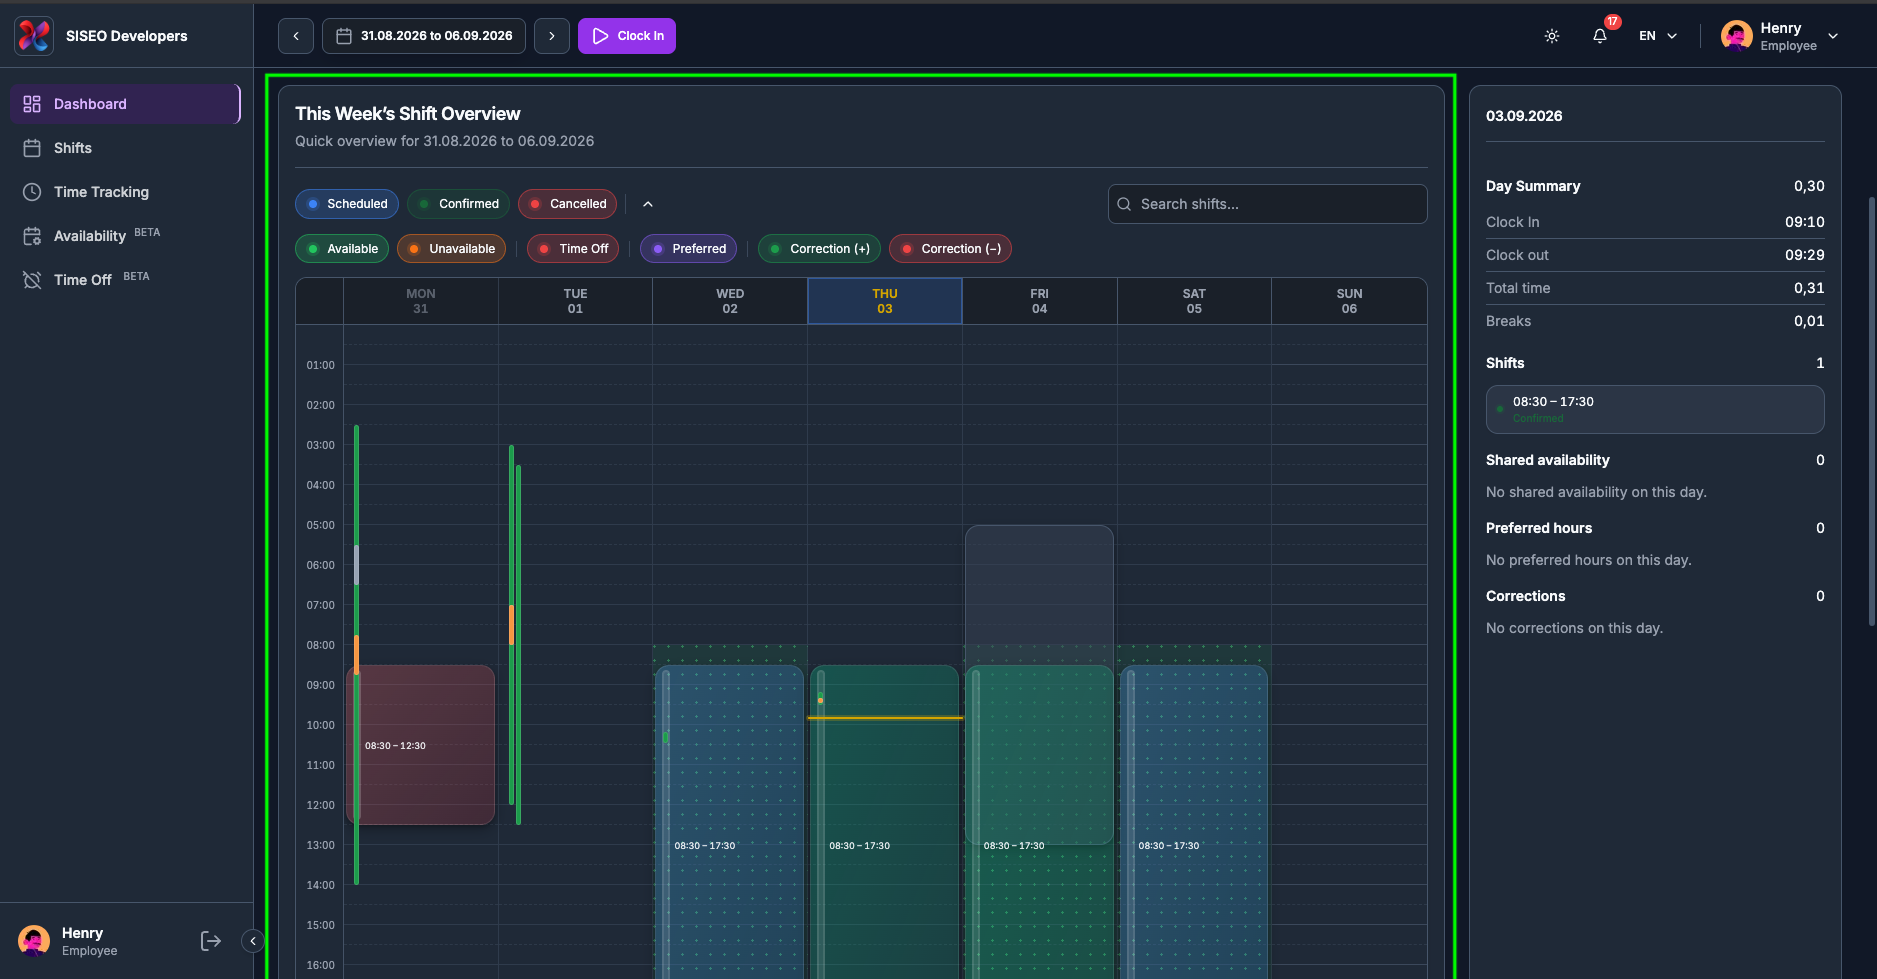
1.6.3Week view
Seven columns, one per day, against an hour-by-hour scale down the left. Shifts are drawn as blocks at their real times, so you can see at a glance how your week is laid out. A line marks the current time in today’s column.
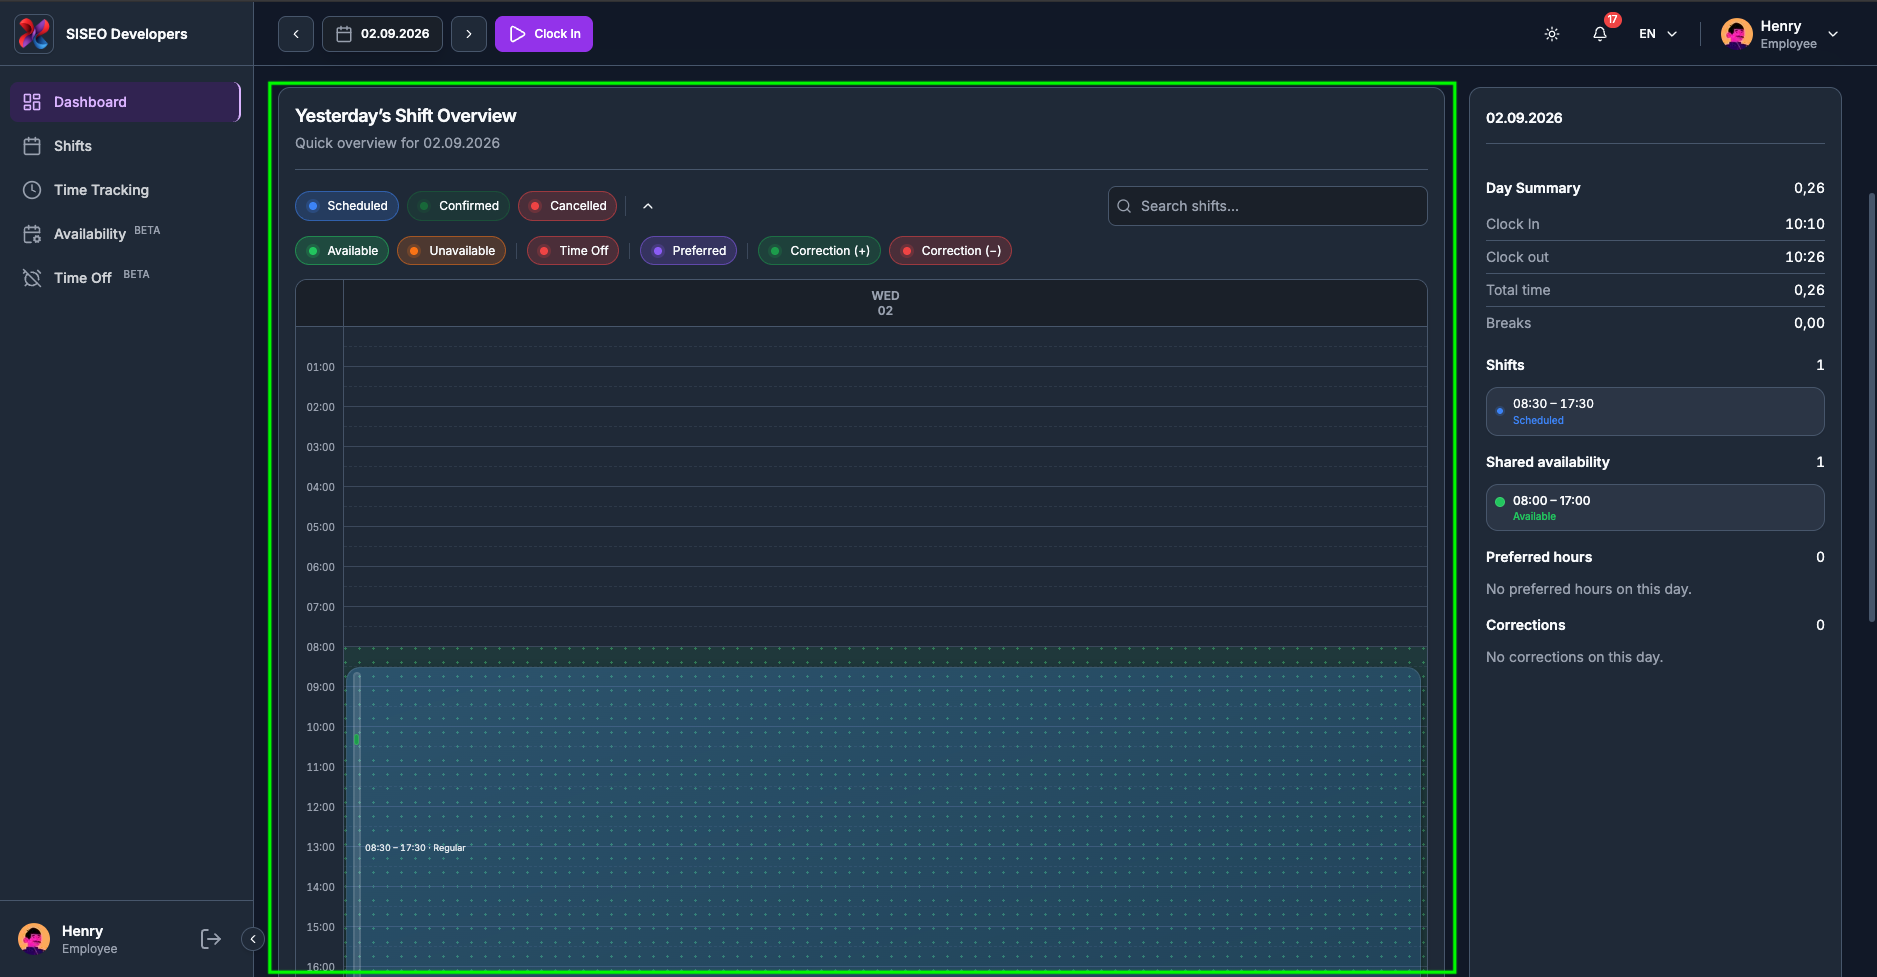
1.6.4Day view
A single day on one full-height timeline, with the same hour scale and current-time line as Week view. Day view always follows the date in the header, so the Day Summary fills in automatically without you having to click anything.
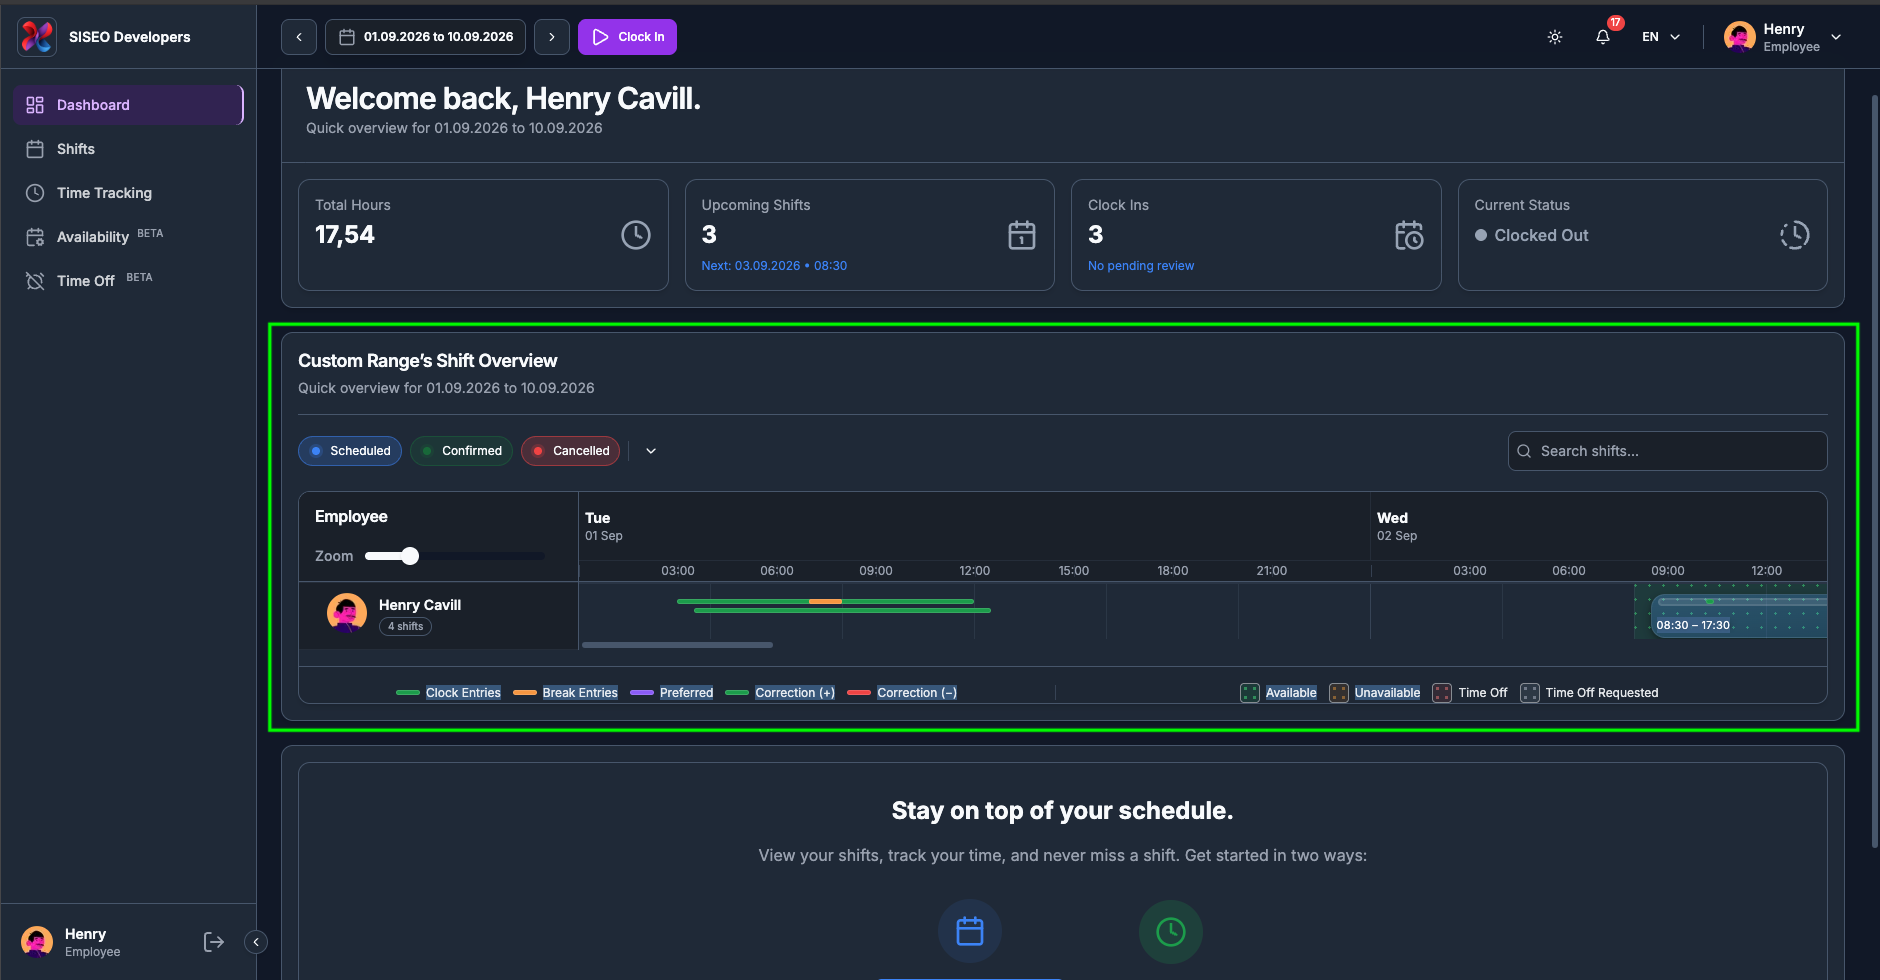
1.6.5Custom range (timeline view)
When you choose a custom range, the calendar switches to a wide horizontal timeline instead of a grid, with dates running left to right. It is the best view for looking at an unusual span, a fortnight, or a whole quarter, in one picture.
1.6.6Anatomy of a day cell
A single day in Month view can carry six different things at once, stacked from the top of the cell downwards:
| # | Element | Where in the cell | What it tells you |
|---|---|---|---|
| 1 | Date number | Top-left | The day of the month. Days from the neighbouring month are dimmed; today gets a highlighted badge; the day you selected is tinted. |
| 2 | Cell background | Behind everything | A dotted wash showing your availability or time off for that day (2.2.9). |
| 3 | Preferred pills | Below the date | Your preferred working hours, when that overlay is on (2.2.8). |
| 4 | Shift pills | Middle of the cell | Each shift you are on that day, coloured by status (2.2.7). |
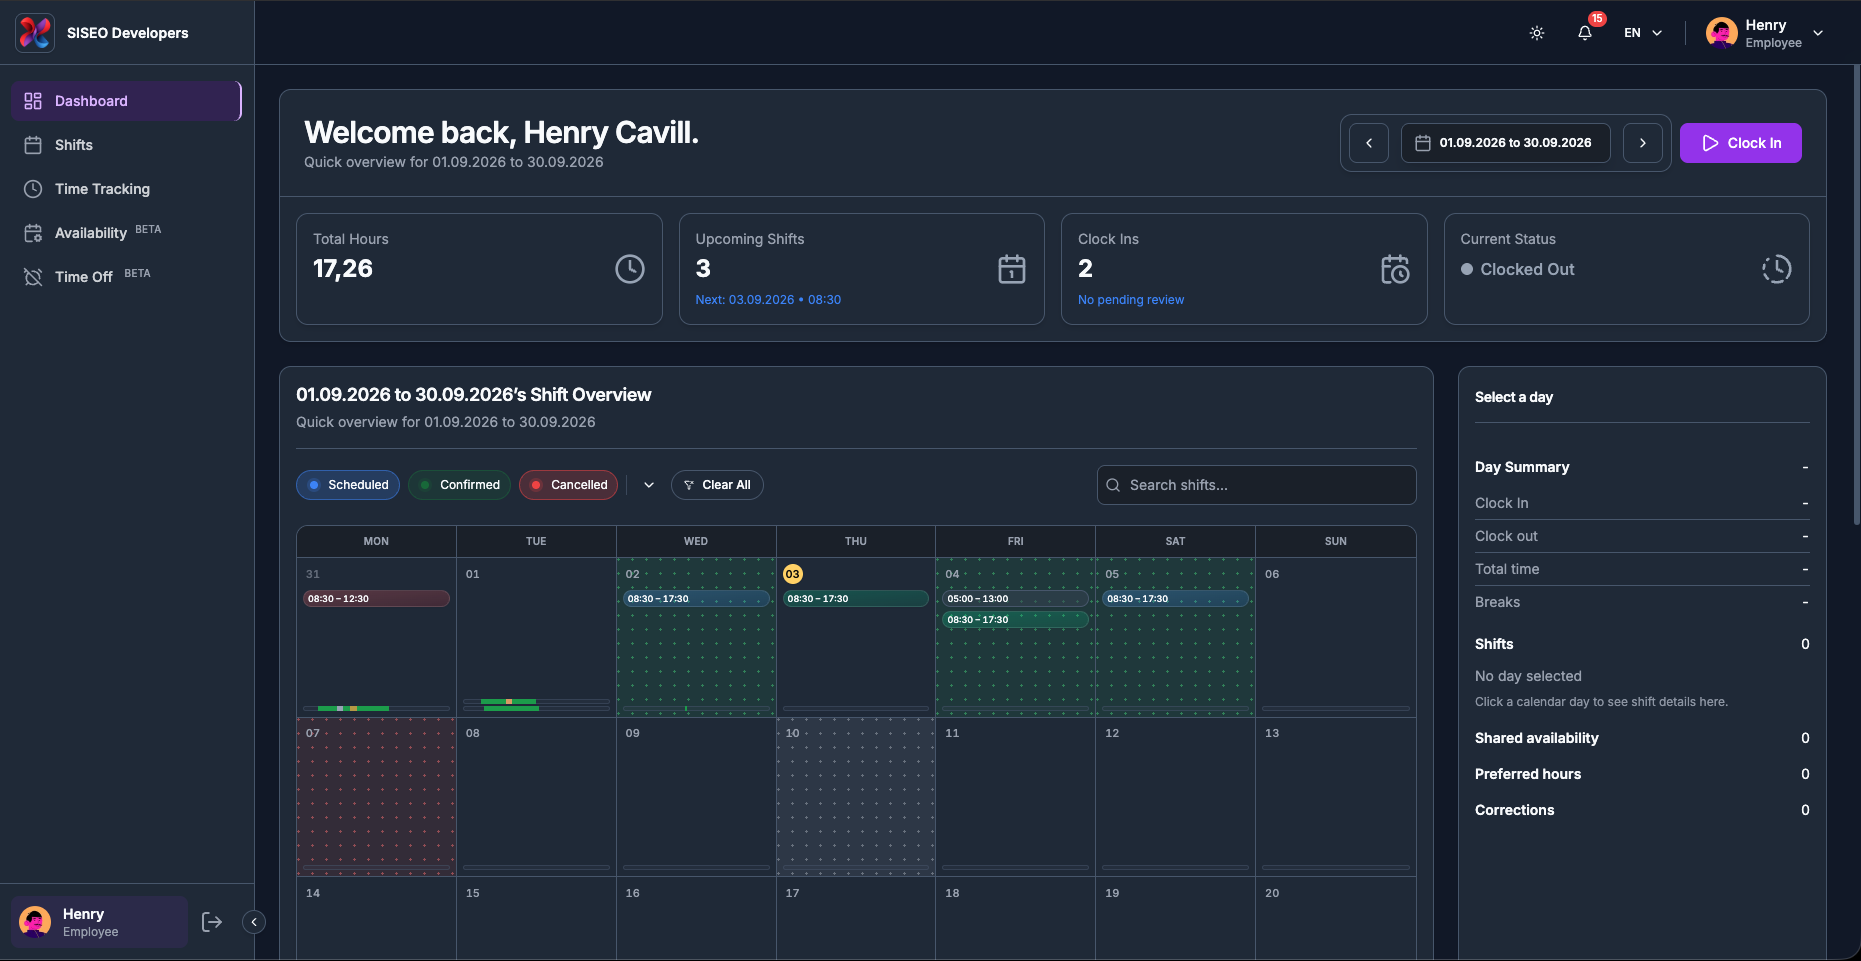
| 5 | Working-time bar | Bottom, always present | A 24-hour strip of the time you actually clocked (2.2.10). |
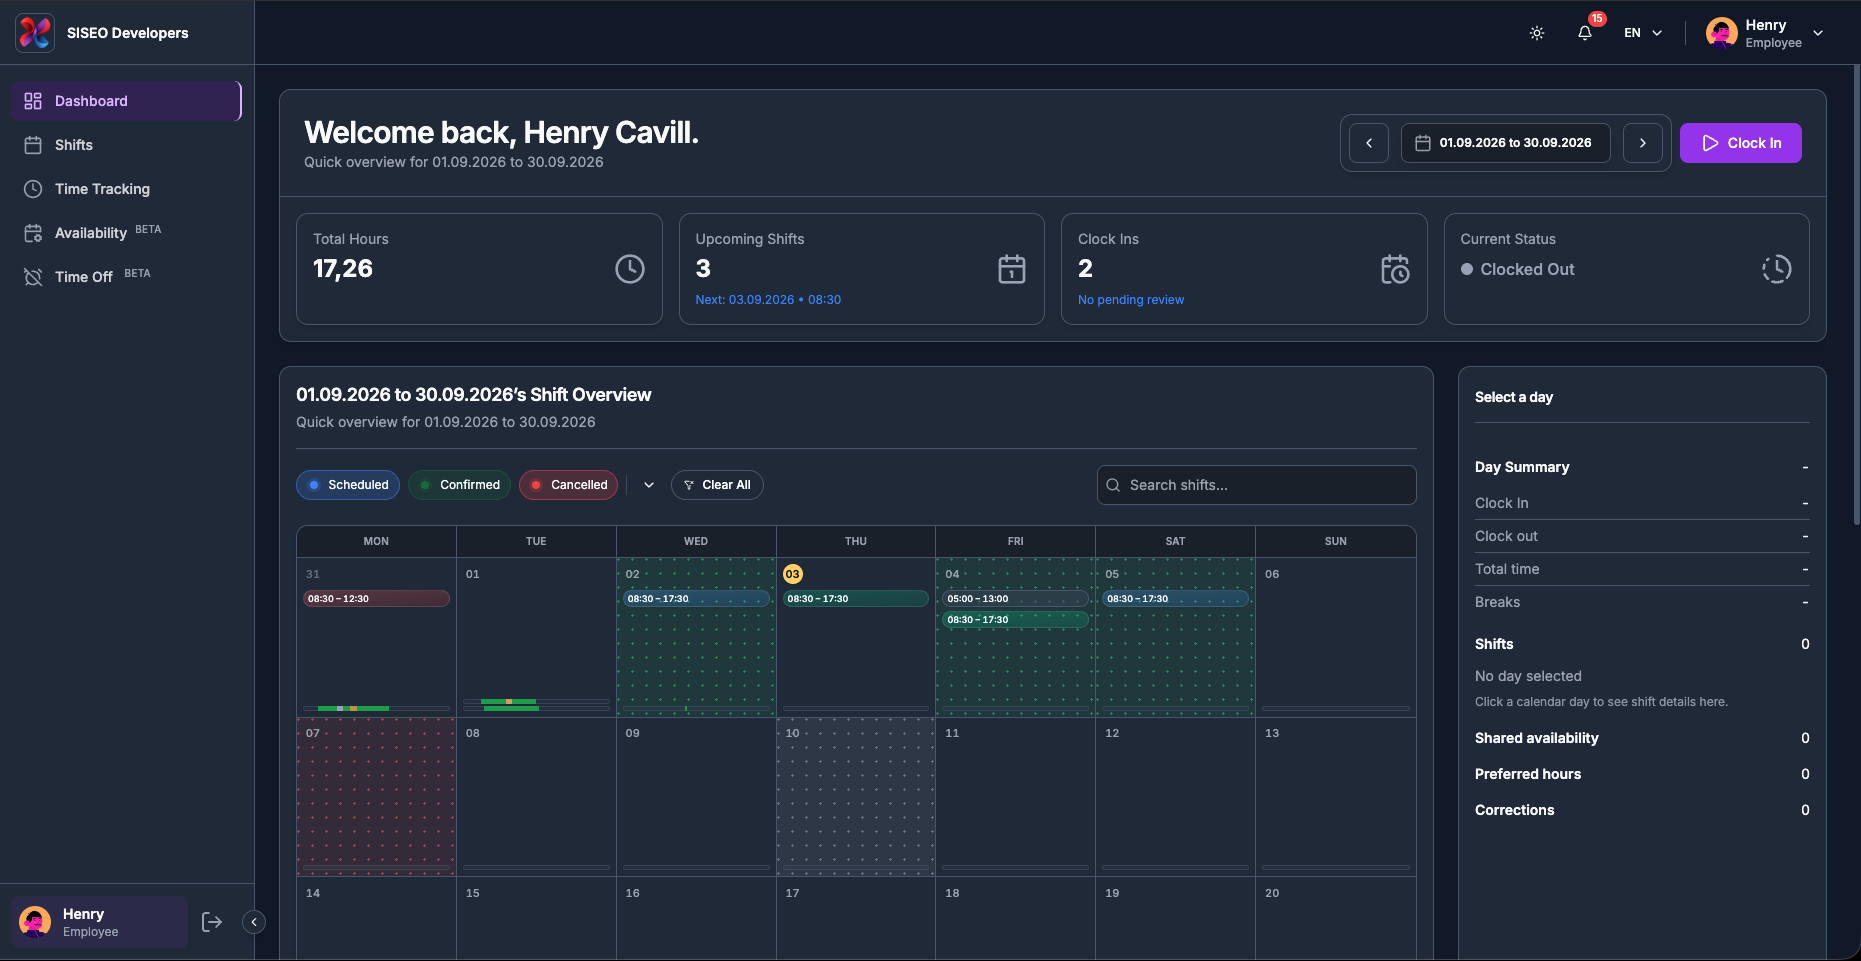
| 6 | Correction bar | Bottom, under the working-time bar | A second 24-hour strip of manual adjustments, shown only when corrections exist (2.2.11). |
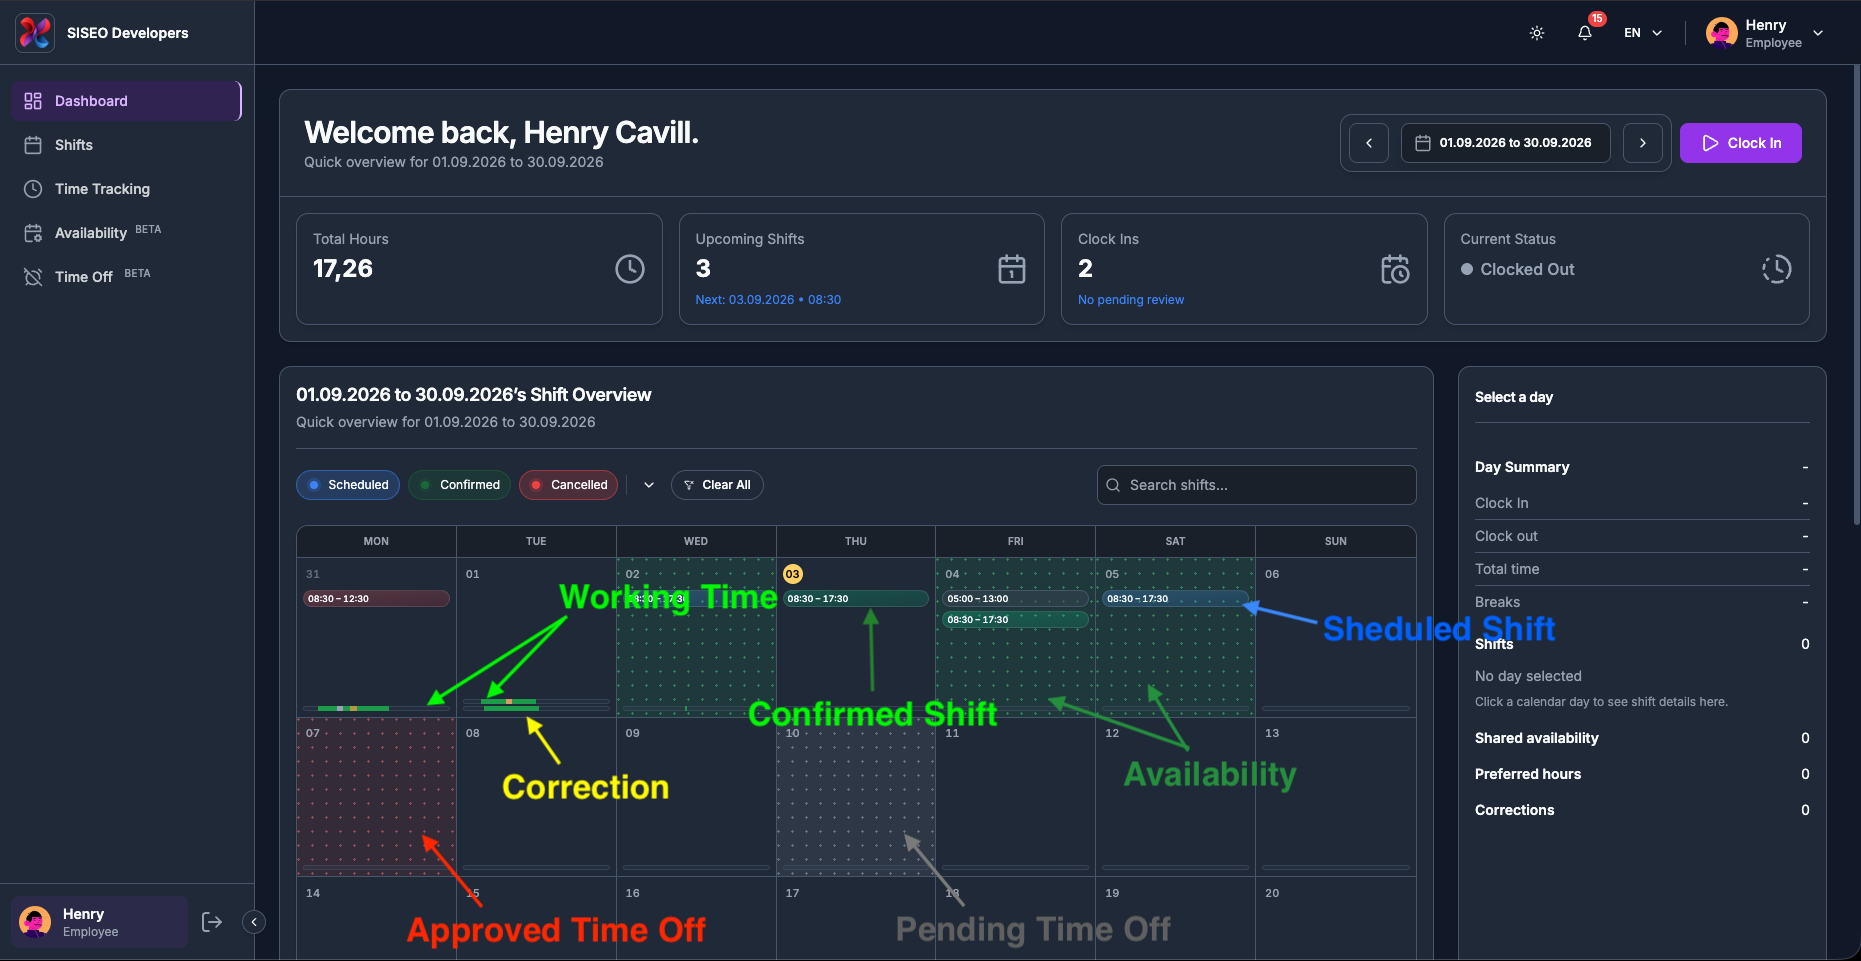
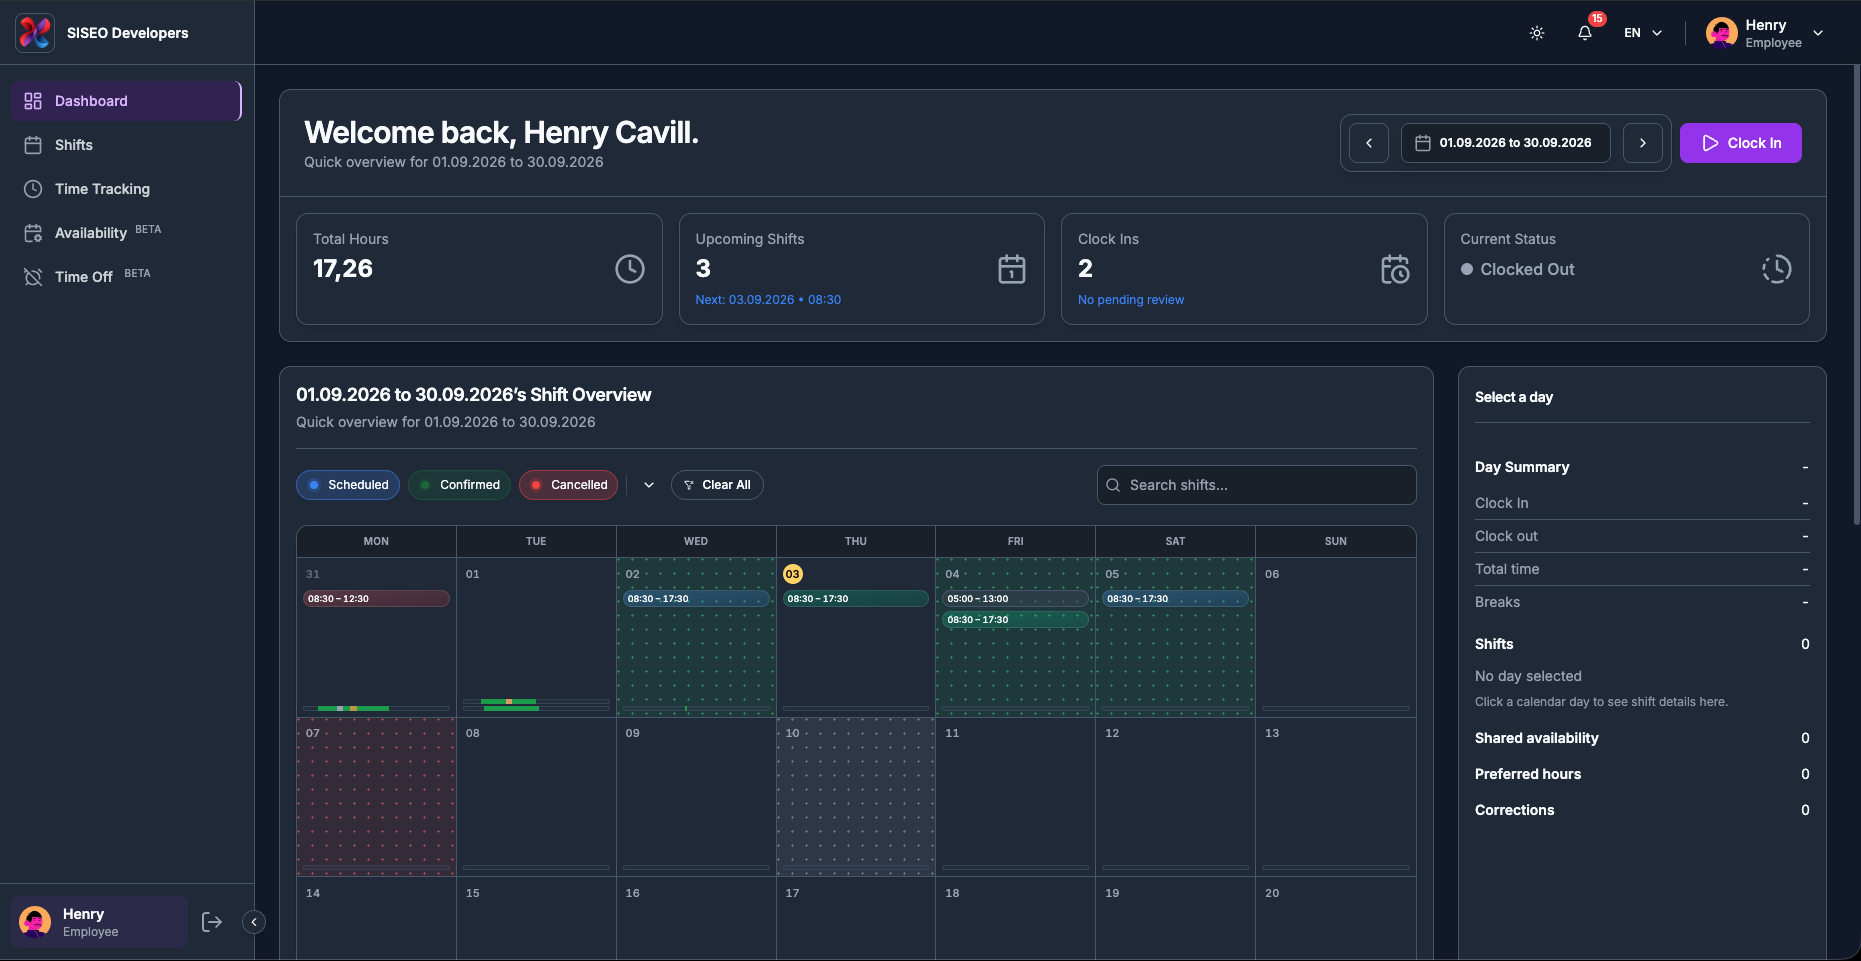
1.6.7Shift pills and their colours
Each shift is a rounded pill showing its time range, tinted by status:
| Pill colour | Status | Meaning |
|---|---|---|
| Blue | Scheduled | The shift is assigned to you but not confirmed yet. |
| Green | Confirmed | The shift has been confirmed. |
| Red | Cancelled | The shift was called off. It stays visible so you know it was there. |
| Teal | Completed | The shift has been worked and closed off. |
| Bright green | In progress | The shift is running right now. |
| Grey / slate | Draft or unassigned | Your manager is still working on it. These are normally hidden from employees. |
A cell shows at most three shift pills. If there are more, a line reading “+N more” appears underneath, click the day and read the full list in the Day Summary panel (2.2.3).
1.6.8Preferred-hours pills
When the Preferred chip is switched on (2.2.2), the hours you said you would rather work appear as a muted pill with a violet accent, above the shift pills. Like shifts, a cell shows at most three, then “+N more preferred”.
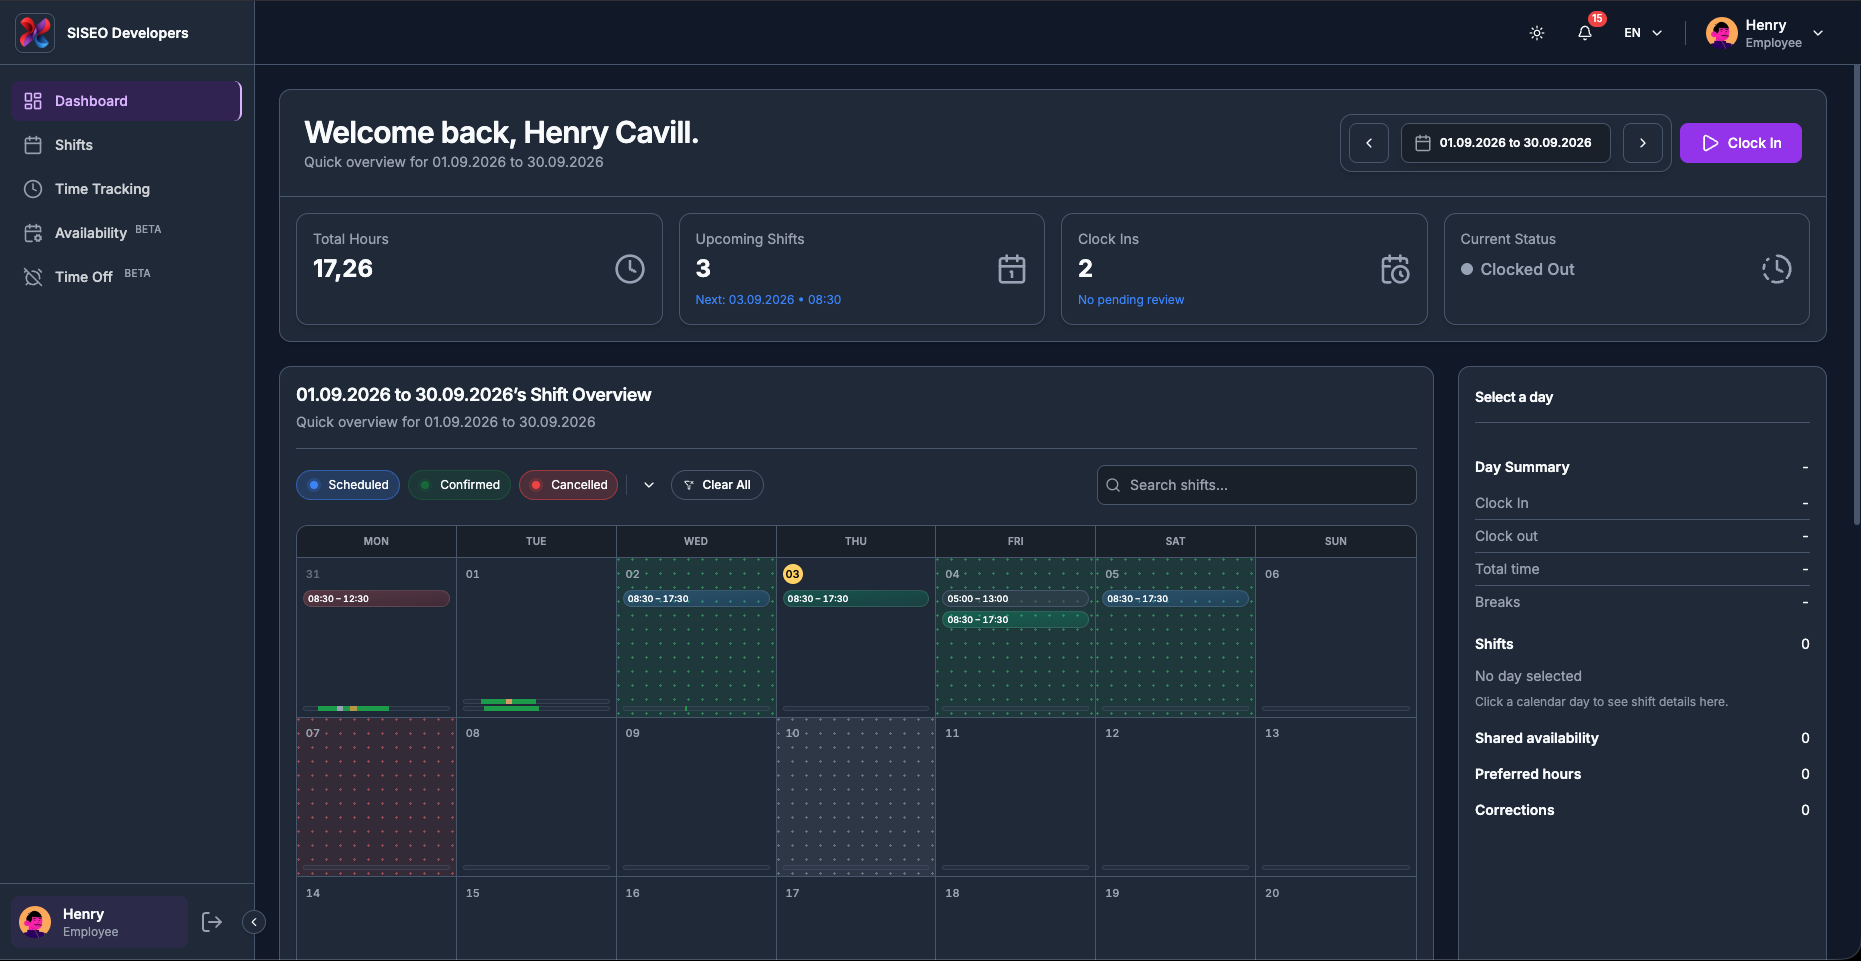
1.6.9The cell background, availability and time off
The dotted wash behind a day shows the availability you shared for it. Each kind has its own colour, and the dotted texture is what distinguishes these background layers from the solid pills drawn on top:
| Background | Meaning |
|---|---|
| Green dotted | Available, you told your employer you can work. |
| Orange dotted | Unavailable, you cannot work that day. |
| Red dotted | Time Off, approved holiday or sick leave. |
| Grey dotted | Time Off Requested, leave you have asked for that has not been approved yet. |
Only one wash is drawn per day. If you have several entries on the same day, the most restrictive wins, Unavailable beats Time Off, which beats Available. And if a day already has an approved wash, a pending request will not grey it out on top.
1.6.10The working-time bar
The thin bar across the bottom of every cell is a 24-hour strip: the left edge is midnight, the right edge is the following midnight. A segment’s position shows when something happened and its width shows how long it lasted, so a morning shift sits on the left of the bar and an evening one on the right.
| Segment | Meaning |
|---|---|
| Green | Time you were clocked in. |
| Orange | A break you took with the Pause button, drawn on top of the green. |
| Pale orange | Break time entered manually rather than clocked, drawn on top of both. |
| Empty outline | Nothing was tracked that day. The empty track is always drawn, so the cells line up. |
A segment that pulses gently is a session that is still running, you are clocked in right now and it has no end yet.
1.6.11The correction bar
If your hours have been adjusted by hand, a second 24-hour strip appears beneath the working-time bar. It is laid out the same way, position is time of day, width is duration:
| Segment | Meaning |
|---|---|
| Green | A correction that added time to your account. |
| Red | A correction that removed time. |
| Orange | A break that was included in the correction. |
This bar only exists on days that actually have a correction, so most cells show just the one bar. The full detail, amount, times and any note, is in the Day Summary panel (2.2.6).
1.6.12Hover anything for a tooltip
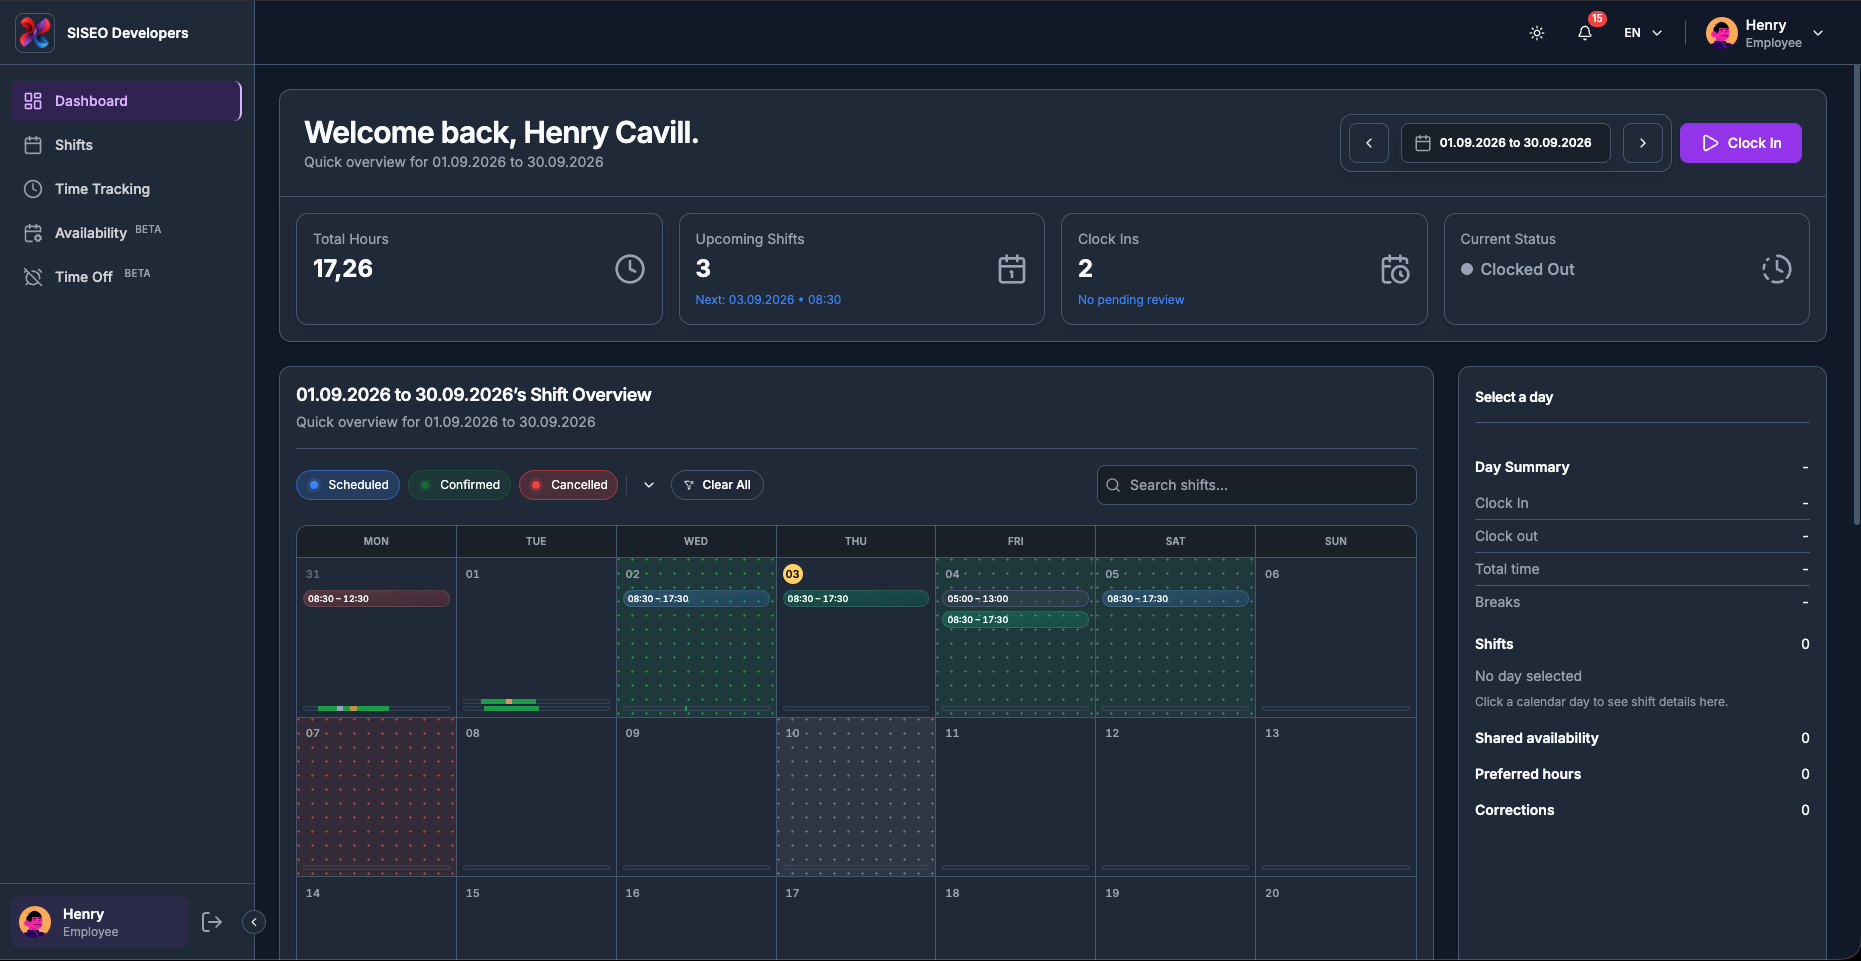
Every pill, bar and background on the calendar carries a tooltip. Hover over the bar and you will see a tooltip with the details. On a touchscreen, tap it instead; tap anywhere else to dismiss it.
| Hover over… | The tooltip shows |
|---|---|
| A shift pill | Shift, <status> with the start and end times underneath. |
| A preferred pill | Preferred working time and the time range. |
| The working-time bar | A summary of the whole day: Worked <time> · Breaks <time> · Manual <time>. On a day with nothing tracked it reads “No time tracked” and reminds you the bars are a share of 24 hours. |
| A worked segment (Week / Day view) | When you clocked in and out. A session still running shows Not Ended instead of a clock-out time. |
| A break segment (Week / Day view) | Break Started and Break Ended times. |
| The correction bar | Correction. In Week and Day view each segment shows whether it added or removed time, by how much, its times, and any note. |
| A pending time-off day | Time Off Requested, with the leave type if one was given. |
1.7The Day Summary panel
To the right of the calendar sits a narrow panel that describes a single day in detail. Its header shows the date you are looking at.
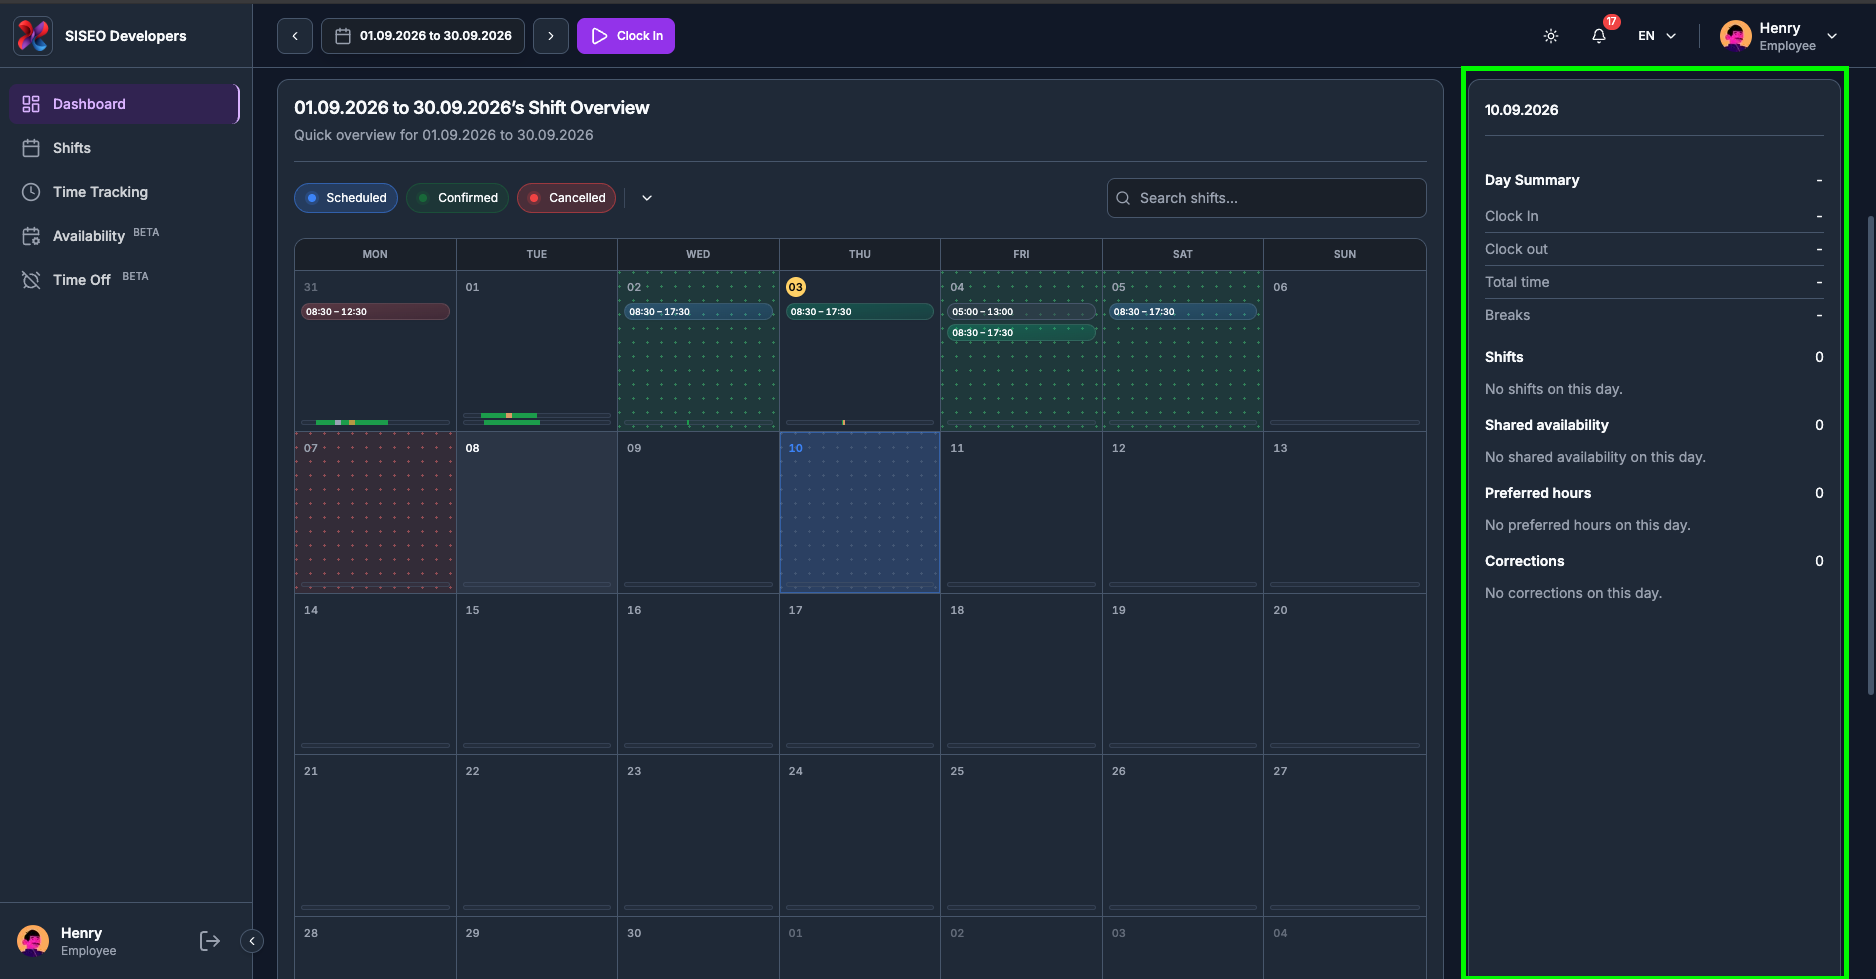
1.7.1How to choose the day
Before you pick a day, the panel header reads Select a day and the body tells you that no day is selected, with the hint to click a calendar day to see shift details.
-
1
Click any day in the calendar. In Week view, click the day’s column header.
-
2
The panel header changes to that date and every section below fills in.
1.7.2Day Summary figures
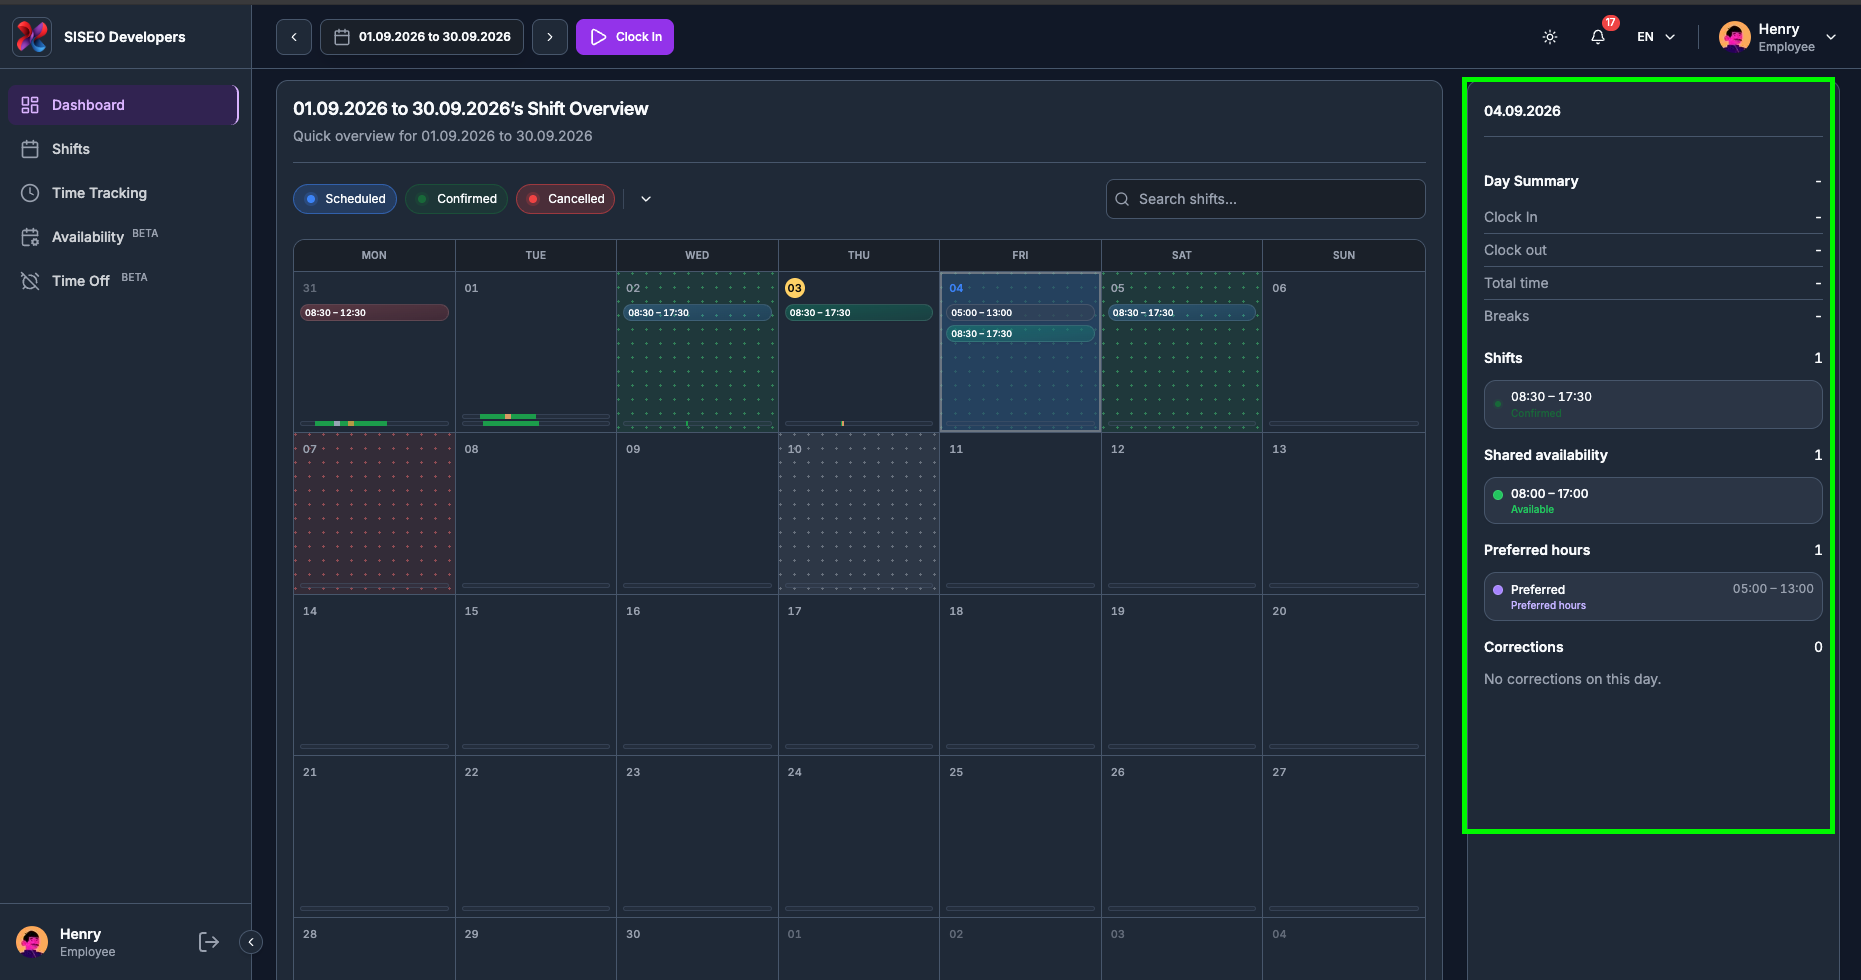
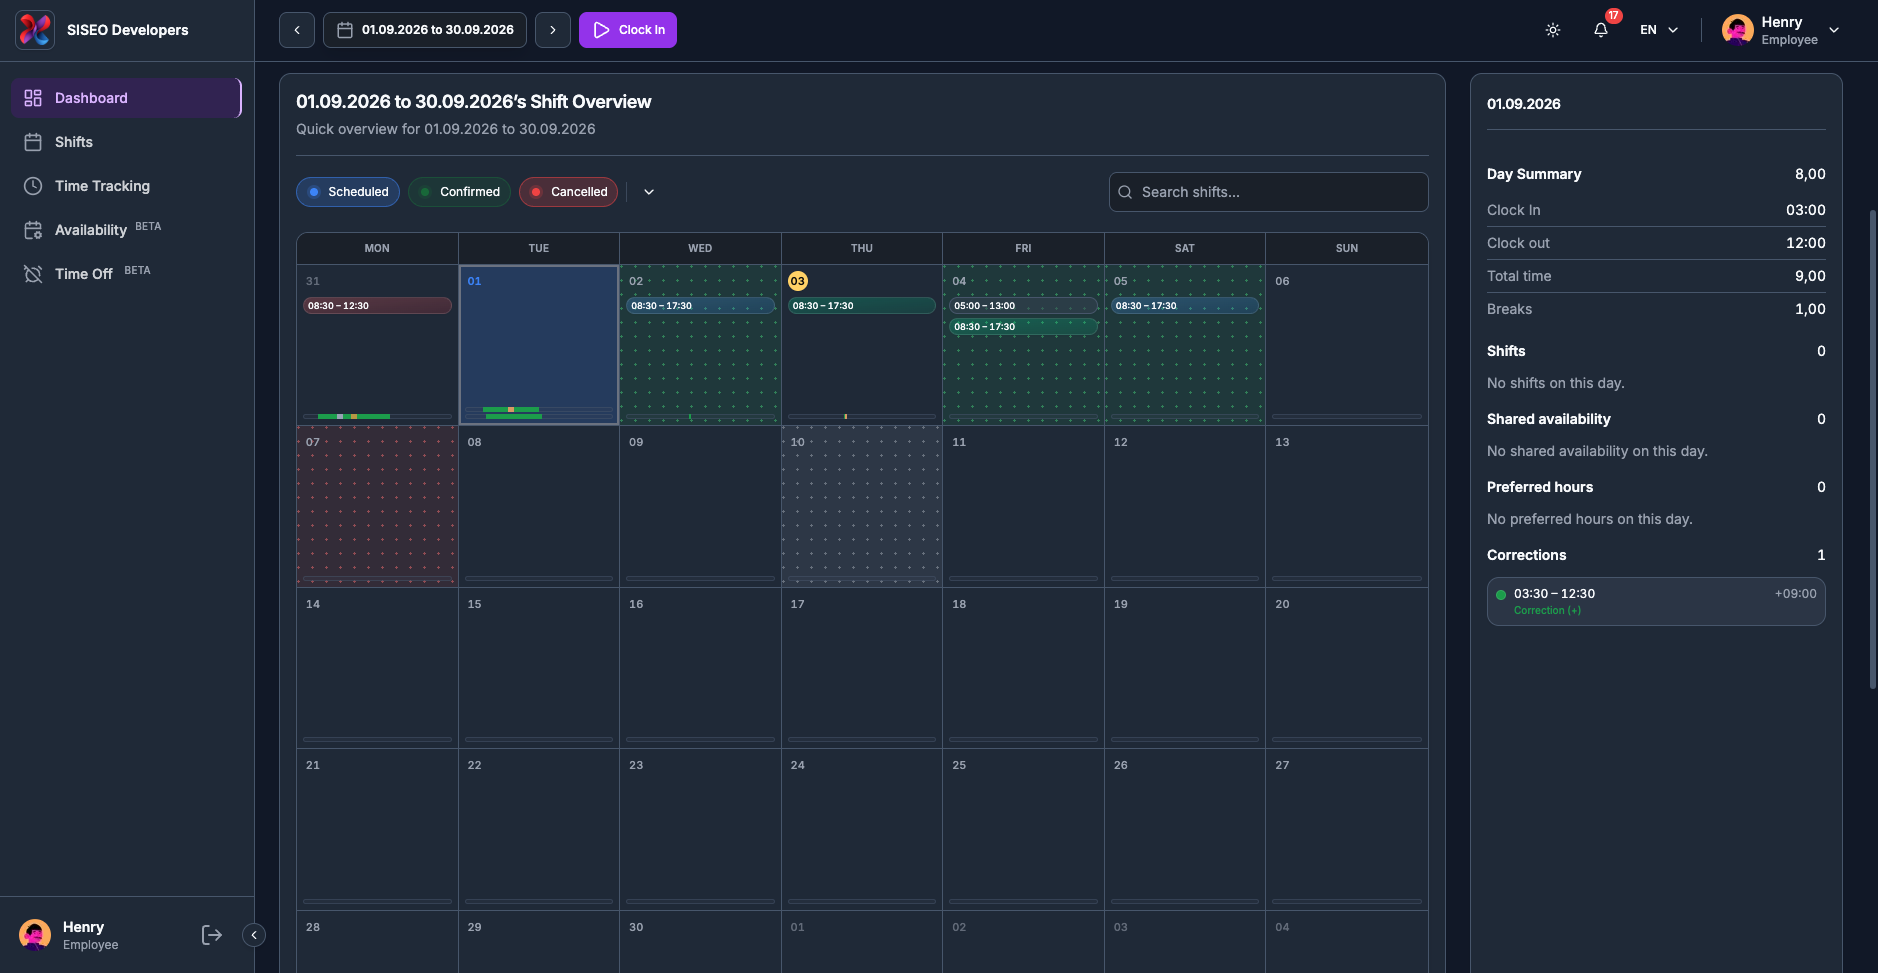
The first block is headed Day Summary, with your net worked time for the day on the same line. Below it:
The figure on the Day Summary line is Total time minus Breaks, the number that matches your Time Tracking page. A dash in any of these fields means nothing was recorded that day.
1.7.3Shifts on the day
The Shifts section counts the shifts scheduled for the selected day and lists each one with its time range and a coloured status dot, blue Scheduled, green Confirmed, red Cancelled. With more than a few, the list scrolls inside the panel. If there are none, it reads that there are no shifts on this day.
1.7.4Shared availability
Shared availability shows the availability you submitted for that day: either a time range or All day, the status underneath in its own colour, and any note you attached. The colours are green for Available, amber for Not available, and red for Sick or Holiday.
1.7.5Preferred hours
Preferred hours lists the working times you told your employer you would rather work on that day, marked with a violet dot and showing the time range plus any note. When you have not set any, it reads that there are no preferred hours on this day.
1.7.6Corrections
Corrections lists manual adjustments made to that day’s hours. Each entry shows the time range it covers, the signed amount, and a note if one was left:
If a correction includes a break, the break’s start and end are shown underneath it.
1.7.7Empty days
Every section keeps its heading and its count even when there is nothing to show, so an empty day still tells you what was checked. A count of 0 with a short “none on this day” line is normal, it is not an error.
1.8Quick Actions
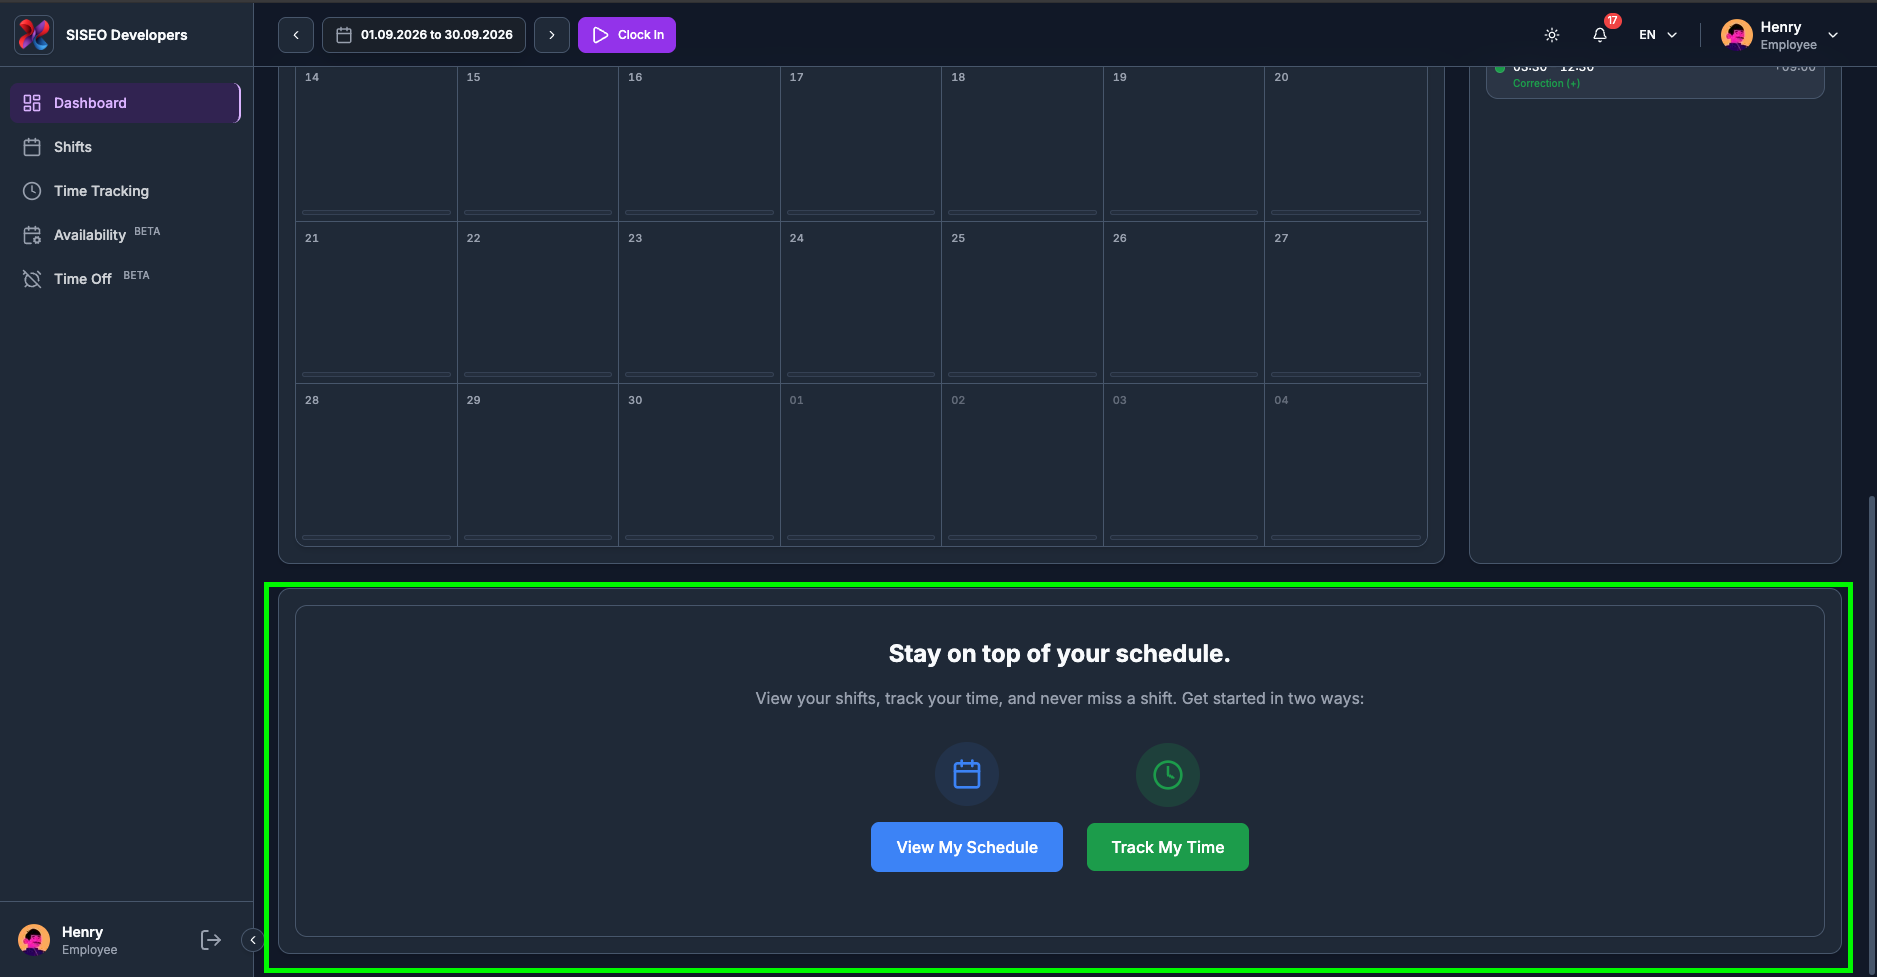
At the very bottom of the page, a card headed “Stay on top of your schedule.” offers two shortcuts:
Both do exactly the same as the matching links in the sidebar; they are repeated here so you do not have to scroll back up.
Leave a Reply